Contents
Introduction
Around 2015, there was a change of generations in cellular networks, and the used stuff market was flooded by miniature rubidium frequency standards from decomisioned base stations. The deals on Ebay were like five untested boxes for 120 euros and similar.
When I became interested in this in 2021, the cheap ones were mostly gone, so I had to reach a bit deeper into my pocket. I bought one Spectratime/Temex LPFRS that was declared "working", and two declared "not locked". Form here on, they are named #1, #2 and #3, #1 being the working one.
Later I used these rubidiums as the reference at my "Ten Mega Party"
First, I wrote a small program, that draws graphs of the values that the LPFRS reports on serial port. Heather can do that, but I don't like the "everything one atop the other" format. The blue band in the graphs marks the desired range for that value. Horizontal scale is one second per pixel, and vertical scale is 0...255. (Download)
Note that graph 1 (top), showing value HH (lamp brightness) should be inverted, so in all three rubidiums, the lamp is weak, should be at the bottom of the blue band. I did not invert it (despite the manual saying I should), because upon switch on, it goes max, and then comes down, so I thought it is OK (lamp increasing in brightness). Later, when I disassembled the no lock units, I saw that in fact, the lamp goes on immediately (buffer gas lighting up), and then decreases in brightness, as the rubidium evaporates. But I already had many measurements screenshots saved, so I decided not to invert it (for this writeup), to avoid causing confusion.
According to the manual, value FF (graph 3) is not used. But obviously, it does measure something. Looked like maybe the temperature. At my first measurement, when I switched on the rubidium, it started high and went down, so I inverted the graph. But later I saw, that it sometimes starts high and goes down, but sometimes it starts low and goes high. So, I gues it does not represent the temperaturee.
Up to table of contents
The working one (#1)
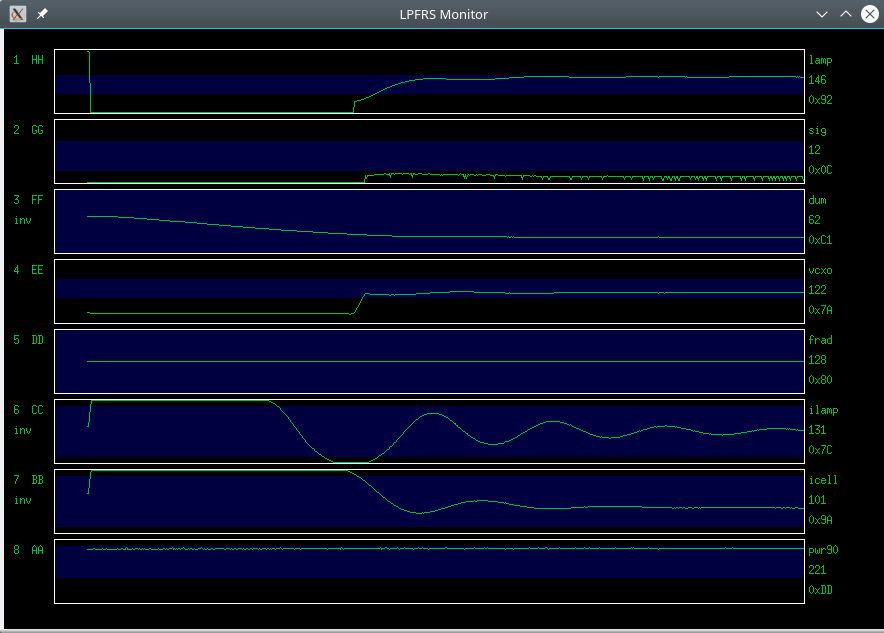
On power up, the lamp flickers for a while (graph 1), sometimes bumping up the signal graph 2 (HH). This probaly happens because the flickering has frequency components in the range, where the detector is expecting the real signal.
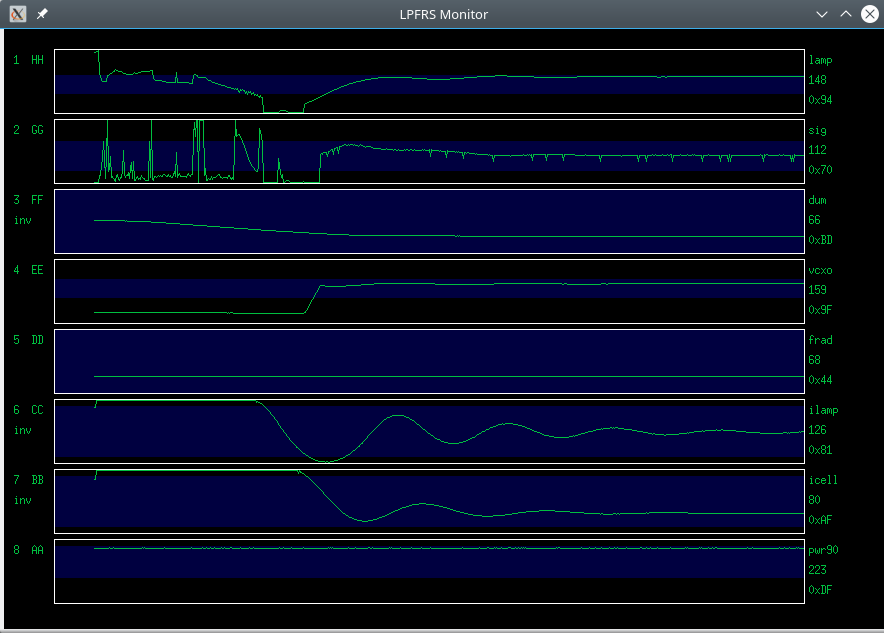
As the lamp reaches temperature (lamp heater current graph 6, CC goes down) rubidium ignites and we get the real signal. The loop locks on first attempt (graph 4, EE). The vcxo voltage is close to the upper limit, but I found no trimming device for adjusting the VCXO.
Lamp intensity is at minimum (graph should be inverted), but the detected signal is in the middle of the specified range. It has some small hiccups, but these do not seem to affect the 10 MHz output, as compared with a different rubidium.
No idea why the thermostats (graphs 6 and 7) have such underdamped loop response. Not something wrong with this one, all of them have the same swing.
Looking closely, the effect of this temperature swing can also be seen in the lamp brightness graph 1, and vcxo voltage, graph 4.
Up to table of contents
The first not locked one (#2)
No surprise, this one did not achieve lock. After reaching working temperature, the controller starts to search for the rubidium signal, but finds none, triangular signal on graph 4:
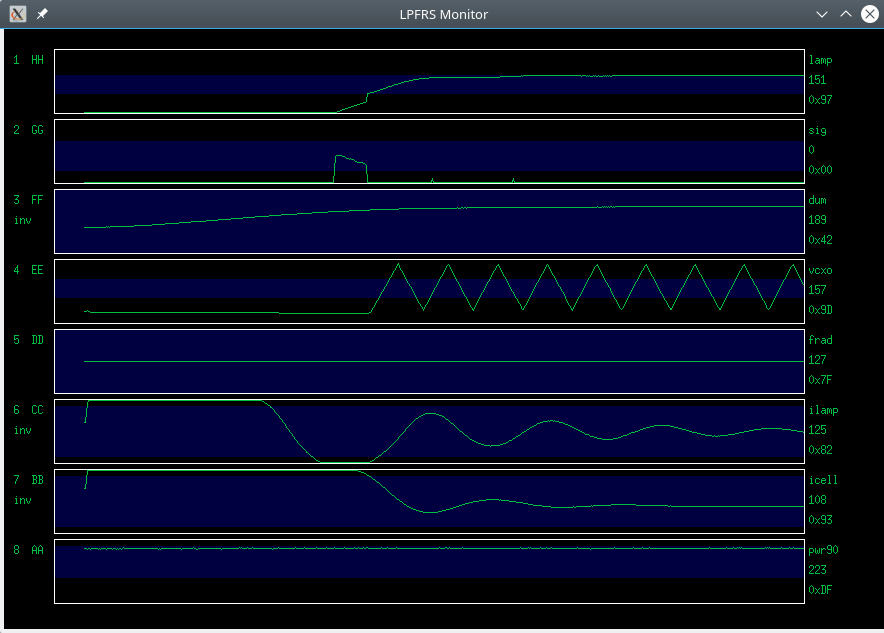
There seems to be some signal, when the lamp starts (graph 2), but that was probably again just lamp flicker masquerading as the rubidium signal.
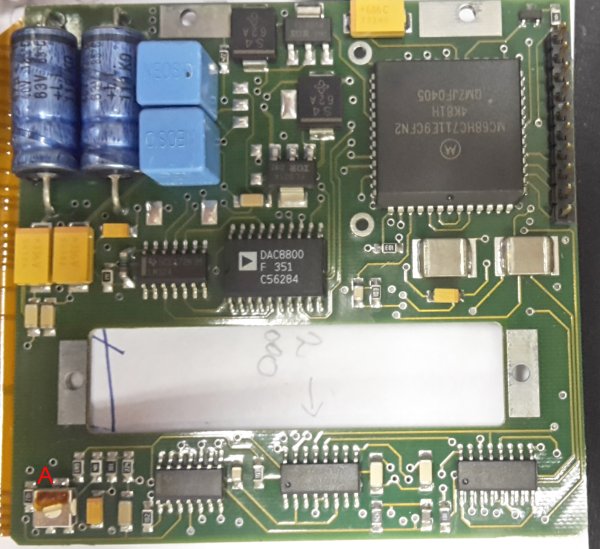
Lucky for me, other people have already opened these boxes, identified the trimmers, and wrote about it. See for example Orange's post (external link) on the EEVBLOG forum.
I started by adjusting the trimmer A, "Demodulated Rb signal". At first, I was a bit skeptical, because it is on the "digital" board, and it could just scale the A/D input.
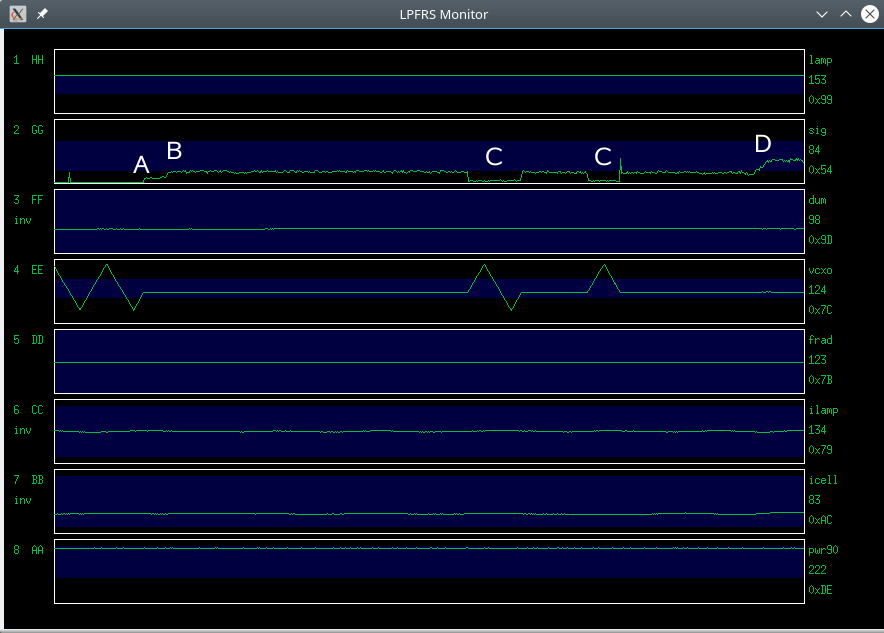
But no, it did raise the signal into the loop, and I got lock even before it reached the blue zone (point "A" below). Turning it a bit more, got the signal to the bottom of the blue zone (point "B"), but the lock was not stable (point "C"). So I turned it fully clockwise (point "D"):
This got the signal to just below center blue zone. But it looked quite noisy, as expected, when turning the gain up on a small signal. So I decided to try boosting the signal up at the source (trimmer B, "SRD bias"),
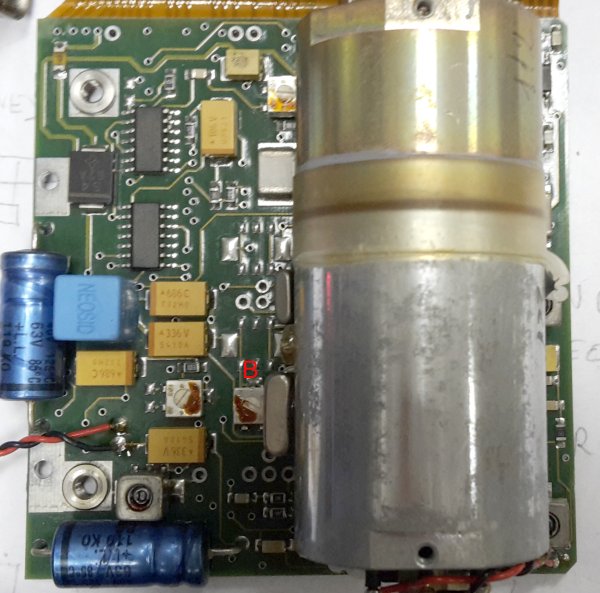
and then diminishing the subsequent gain with trimmer A (point "E" below):
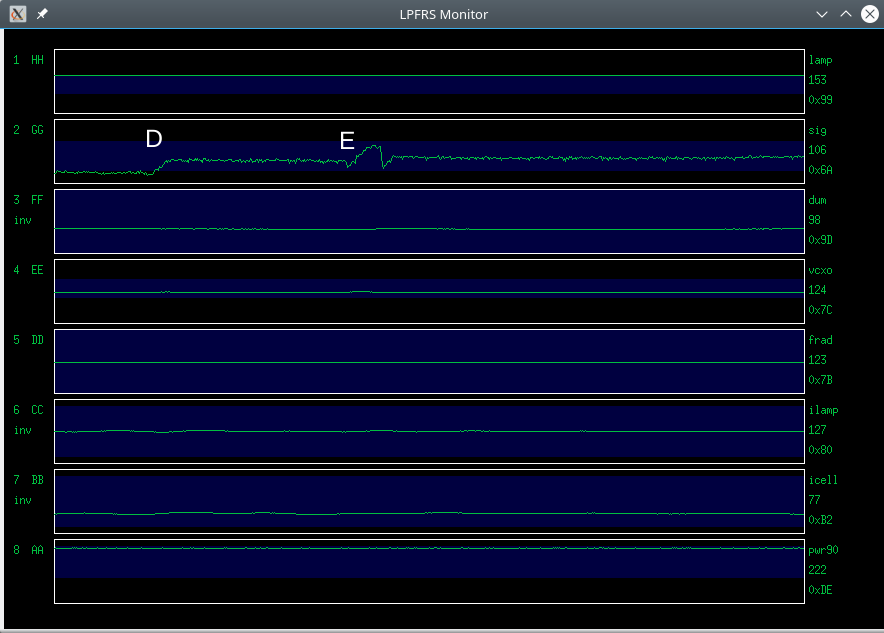
I'm not sure that reduced the noise, but the lock was stable, so I just closed the box. Will have to do some measurements how much this noise affects the quality of the output signal, if it gets passed on to the vcxo control voltage.
Up to table of contents
The second not locked one (#3)
Surprisingly, this one did lock, although with a very low rubidium signal:
I decided to open it anyway, to try to increase the rubidium signal level a bit. Turning trimmer A a little clockwise easily accomplished this:
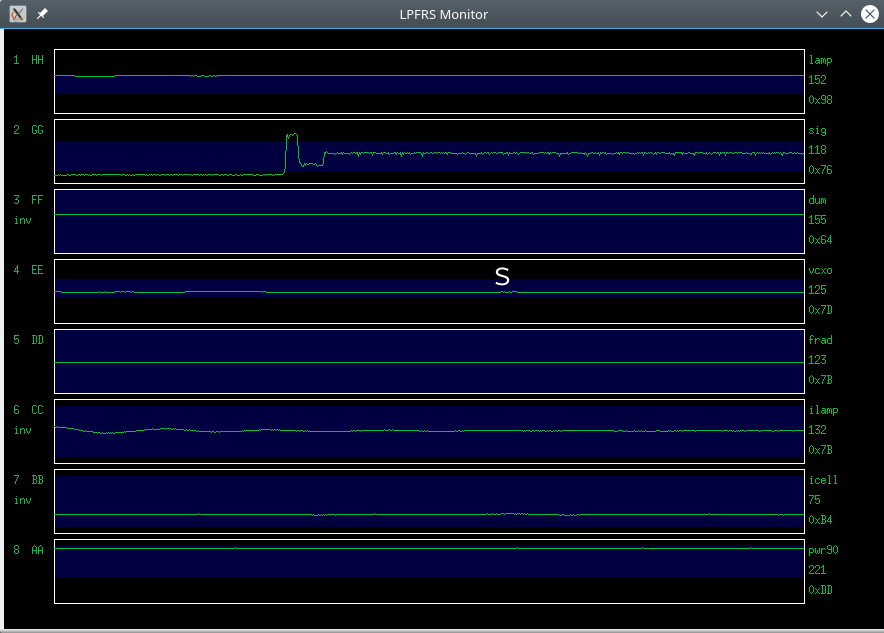
Again, this visibly increased the noise, and there is some "scruff" ((C) Jocelyn Bell) on the vcxo voltage ("S" above), will have to look into this in the future.
While I had the boxes open, I also measured the ripple on the electrolytic caps, and it was <100mV on all of them, so I decided not to recap.
Up to table of contents
A test of stability
To check the longer term stability, I compared the three rubidiums with a Trimble GPSDO, letting each one run for eight days. I also measured the room temperature, which wasn't very stable. The results are shown below. Left side are frequency graphs, right side temperature graphs. Top is LPFRS #1 , below are #2 and #3, the two that were "resuscitated". I have removed the fixed offset and linear drift from the frequency graphs, to emphasize the random dancing. Vertical span of the frequency graphs is plus minus 1E-11.
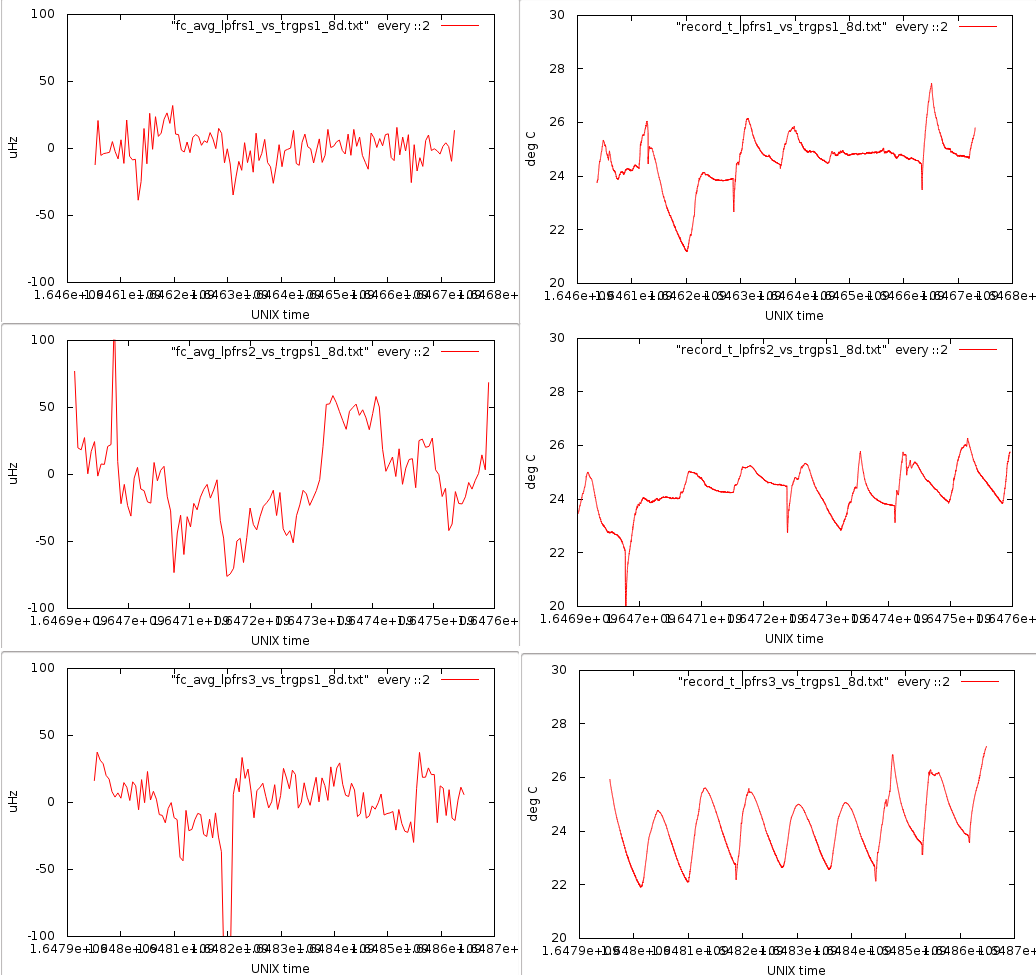
The frequency values are 40 minute (8 days divided into 128 intervals) averages. The drifts were 13.8, 28.9 and -6.88 uHz per day. (One uHz at 10 MHz equals 1E-13) There seems to be a slight negative (lower T, higher f) temperature dependence. And, of course, the GPSDO isn't perfect either. But I think the temperature sensitivity is mostly from the rubibiums, because the Trimble GPSDO has a very fast loop (about one second), which should easily regulate out the slow temperature changes.
The first one looks the best, so a weak lamp seems to impair the stabilty.
The sharp downward spikes on the temperature graphs are window openings.
Up to S57UUU Home Page