Contents
- Introduction
- History and theory
- So, what are the "gotchas"?
- Measurement at audio frequencies
- Measurement at RF
- First attempt
- Improved mixer
- How about dividing
- Audio preamp
- Influence of LO (in)stability
- A simple 9.99 MHz local oscillator
- Some measurements
- Phase noise and Allan deviation
- Noise and stability
- No downconversion (audio frequency input)
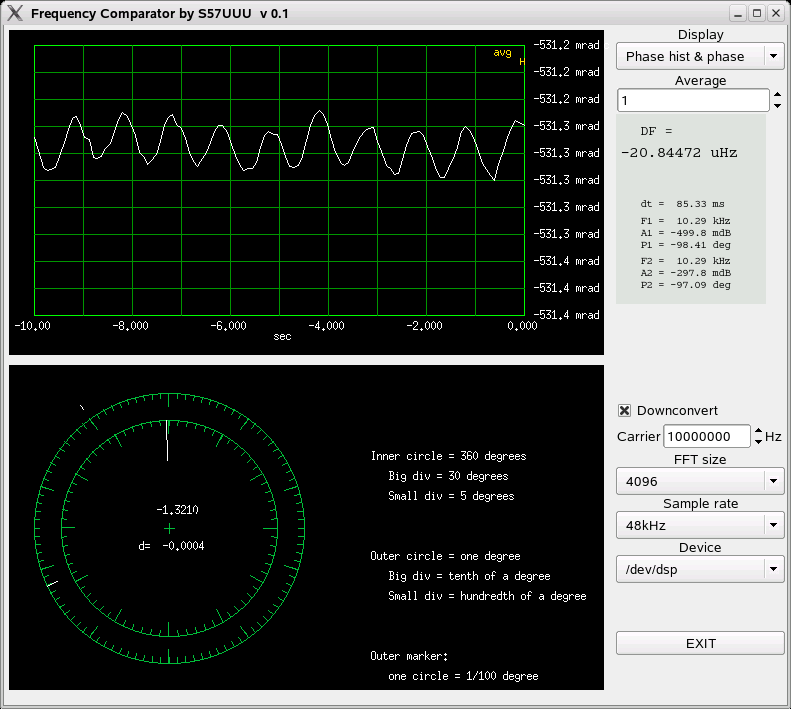
- 10MHz with downconversion to 10kHz
- 10MHz with downconversion to 2kHz
- 500MHz with downconversion to 10kHz
- The $%^$*%$@@! cables!!! (update 15 dec 2021)
- Conclusions
- Software Download
- (a sort of) User Manual
- References
Introduction
This program uses the sound card, "phase comparator" style, to measure very small frequency differences (mHz and uHz) in real time, using time derivation of mutual phase.
Normally, it can measure audio frequencies, but with a simple additional circuit, it can also compare arbitrary RF frequencies, similar to the DMTD (Dual Mixer Time Differece) method [1],p4. Maybe this could be called the DMFD (Dual Mixer Phase Differece) method.
With optimal level, low noise input signals, it can measure the frequency difference to a microHertz in a second! One uHz is 1E-10 at 10kHz and 1E-13 at 10 MHz, measured in one second!
This is very handy for adjustment of OCXO frequencies, for example. No waiting for the result, just live tuning.
Up to table of contents
History and theory
When experimenting with ways to "abuse" a sound card, one idea was to find peaks and measure their frequencies in a FFT display. Using "center of gravity" methods with some correction tables, I was able to measure strong signals down to better than 1/100 of the FFT bin size. Measuring the phase change between successive FFTs, even better resolution was possible.
Of course, the absolute accuracy of sound card clock oscillators is not worth talking about, so all that precision was not worth much for absolute frequency measurement. But (most of the) sound cards have stereo inputs, so high precision frequency difference measurements should be possible. In this case, the relative error of the sound card clock only applies to the frequency difference. For example, say the sound card clock error is 1E-4. When measuring a 10mHz difference between two signals, the 1E-4 error applies to the difference. Therefore, we are measuring to a precision of 1E-4 times 10mHz, that is 1uHz. For an 1mHz difference, the error is 100nHz, etc.
With a full scale signal on a 16 bit A/D, the minimum phase increment, that can be measured, is arcus tangent of 1/32767 or 3.05E-5 radians, or 0.00175 degrees, from a single complex sample, assuming a noiseless signal. Of course, sound cards are noisy, so the precision from a single sample will be much worse. But that noise also acts as a dithering signal, so we can use averaging to get even better precision. In frcomp, "pre detection" averaging is done by the FFT, and "post detection" averaging can be added after the FFT.
In practice, on my old HP vectra (82801BA/BAM AC97 Audio), at 48kHz and 4096 FFT, with full scale signals, mutual phase measurement is stable to better than 0.0005 degree. At 10kHz this corresponds to 0.14 ns (140 picoseconds) - not bad for a sound card! When using external mixers to measure 10MHz signals, we go sub-picosecond.
With standard sound card sampling at 48kHz, and a FFT size of 4096, we get a measurement every 85.3 ms (11.7Hz). Assuming a resolution of 0.0005 degrees, the frequency resolution is phase change divided by time interval = 0.1mHz.
Doubling the FFT size improves the resolution almost four times, because it both decreases the noise and increases the time interval. With an 32768 FFT, noise on the frequency measurement is about one uHz, measured every 0.7 seconds.
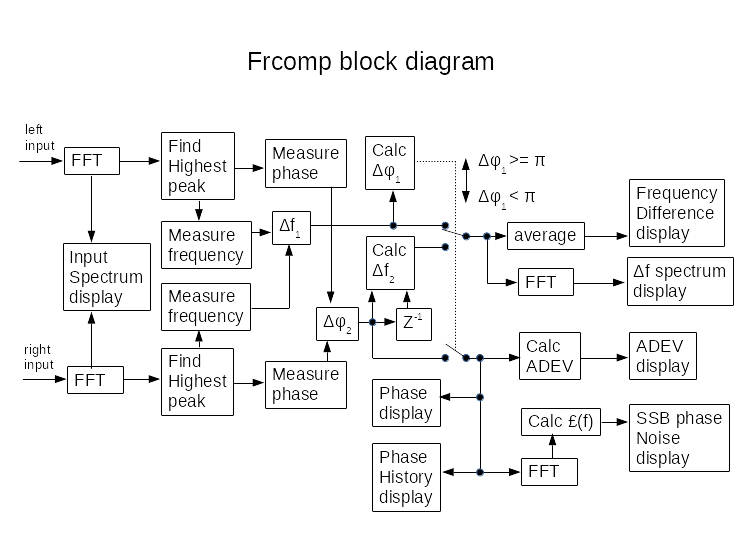
The program works by first doing FFT on both channels. Then it searches for the highest peaks, and measures their frequencies, using the center of gravity technique. From the measured frequencies, it calculates the expected phase change between two successive FFTs. If it is less than 90 degrees (half Nyquist), it proceeds to calculate the precise frequency difference from the actual mutual phase change.
Up to table of contents
So, what are the "gotchas"?
OSS
Frcomp communicates with the sound card via the OSS API. OSS is considered obsolete, and is not active in any of the new distros. Luckily, in most cases, it can be enabled with the
sudo modprobe snd-pcm-osscommand. Then do
dir /dev/ds*to check that you have the
/dev/dspor similar device with suitable permissions. If needed, do
sudo chmod 666 /dev/dspor whatever your device is, to get access to the device.
Note that even with snd-pcm-oss, ALSA still sits between you and the sound card. So far, it has worked for me. But no guarantee that in the future, some developer will not make an "improvement", that will mangle the samples.
Sadly, newer versions of Ubuntu do not include snd-pcm-oss anymore. OSS programs now must be run with the "aoss" wrapper, like:
aoss ./frcompI am not an Ubuntu user, so can't say how good this works.
I am using OSS because it is the "cleanest" way to talk with a sound card. All of the currently popular sound systems (pulse audio, arts, jack...) do horrible things, like resampling and equalizing, behind your back. This may be OK for musicians and gamers, but sucks if you want to extract meaningful data from the samples. So get rid of these.
LEVELS
To get the performance described above, the S/N at the A/D input must be maximized. In a sound card, there is usually a "mixer" in front of the A/D. In most cases, you get the best S/N, when the mixer control for the input is set to its lowest non-zero value, and you provide enough signal at the input, to get just below A/D saturation. This might lead to clipping in the stages before the mixer, so experiment a little. Line input is usually much better than the microphone input.
On my old Vectra, I need 5.9 Vpp into the line input, with the "capture" control all the way down. (Kmix, Suse 9.3).
With the IF (audio) preamplifier described below, I get this with about 800 mVpp at the mixer inputs, the point at witch the mixer starts to compress.
When I put an 10dB 50 ohm attenuator on the outputs of most of my OCXOs, GPSDOs, etc. I get approximately this level.
Frcomp has an input spectrum display, to help set the level and check the noise.
Up to table of contents
Measurement at audio frequencies
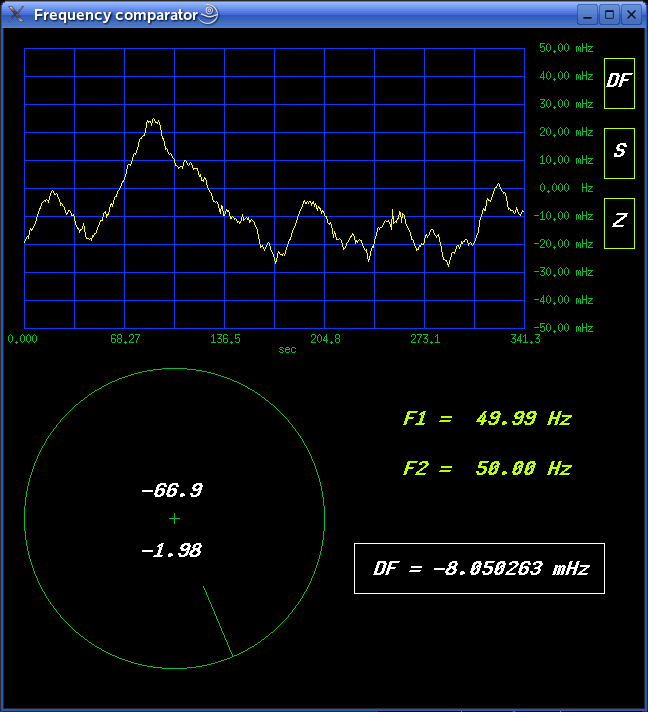
For the first try, I decided to measure the power line frequency deviations. Since the politicians have polluted the power grid with those stupid windmills, the line frequency is quite jumpy! I used a small 230 to 6V transformer connected to a variac, to set a suitable level to the line input. The other channel was connected to a HP33120A function generator as the reference 50Hz.
With an older version of the software, it looked like this:
Up to table of contents
Noise floor
The noise floor of the sound card, with a FFT size of 65536, sound card
mixer set to minimum, and line inputs disconnected, looked like this:
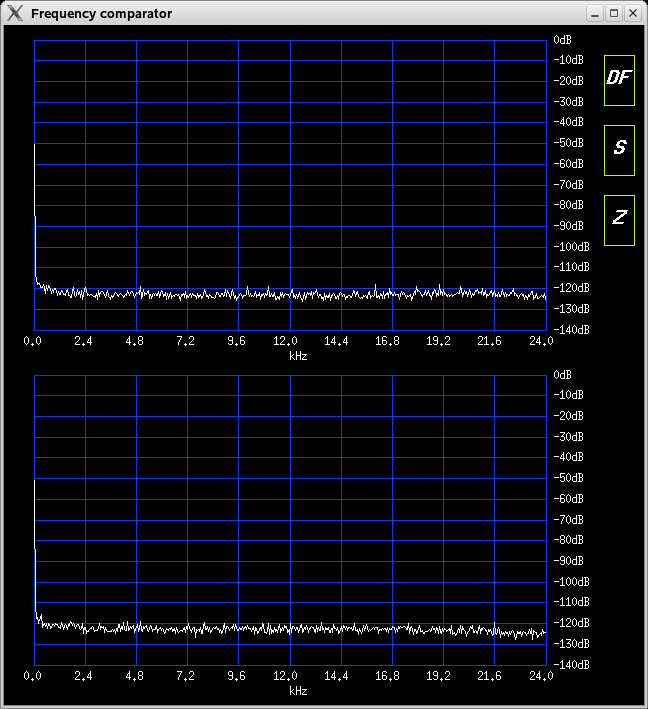
Note that this is INCREDIBLY CLEAN for a sound card!! Those old HP machines really rock!
Setting the sound card mixer to maximum, raises the noise floor by about 20dB and causes some spikes:
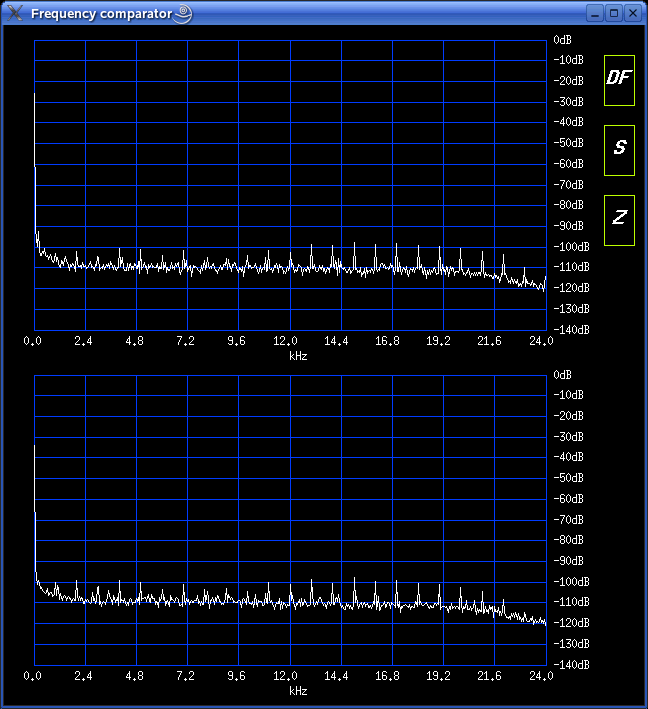
Therefore, I always try to keep the sund card mixer at minimum gain.
To measure the noise floor of the frequency difference measurement, I connected the HP33120A output to both inputs in parallel (no special splitters, just tied everything together). This should give a zero frequency difference.
Then I set the level to just below saturation (see input spectrum below):
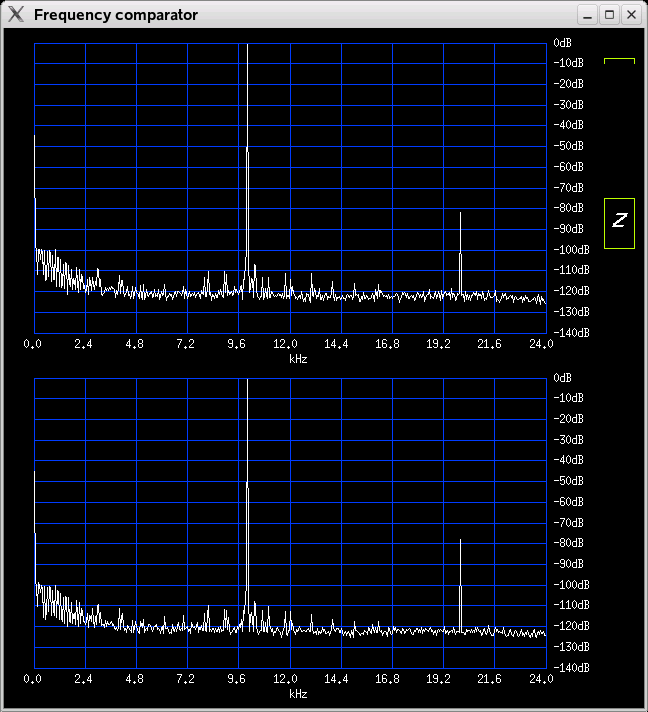
With a 65536 point FFT, with no additional averaging, the noise was less than 400nHz (nanoHertz!) pp:
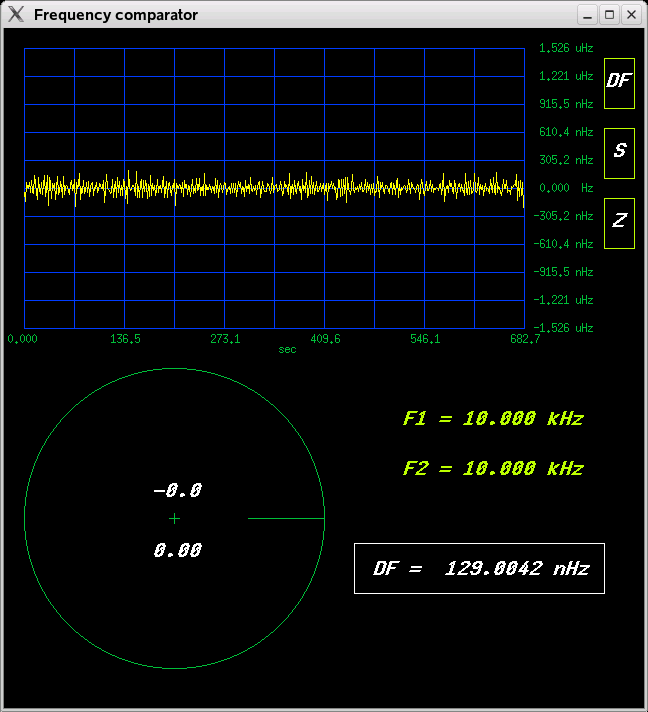
At 48kHz sample rate, an 65536 point FFT gives a measurement every 1.37 seconds.
Up to table of contents
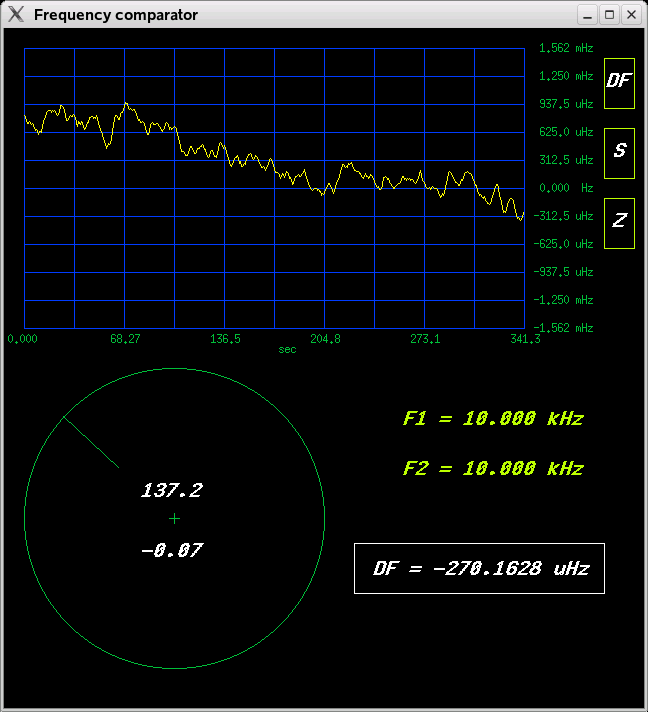
Comparing two audio signal generators
Comparing the HP33120 with a HP3245, after a couple of hours warmup, clearly
shows some drift and dancing:
Up to table of contents
Measurement at RF
Using the fact that relative phase and frequency differences are preserved, when two signals are mixed with the same LO, arbitrary frequencies can be compared, provided their difference is less than the sound card bandwidth.
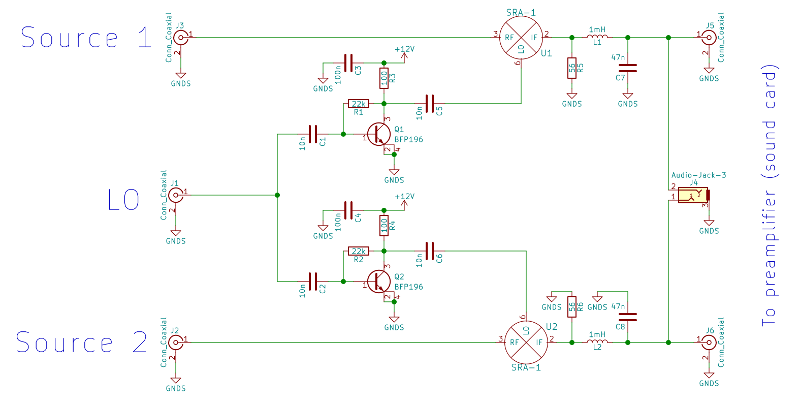
The schematic below shows the general idea. Old Mini Circuits mixers like IE-500 or SRA-1 are perfect for this. Just check that their IF output goes down to DC.
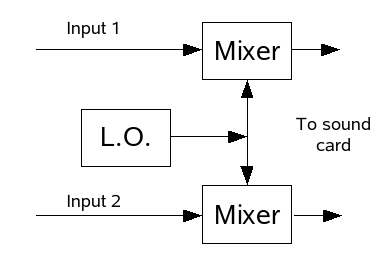
Apart from the obvious need to produce an output within the sound card frequency range, there is one IMPORTANT requirement for the L.O. - it must NOT LIE BETWEEN the two frequencies to be compared. It must be either below or above of both. If above, the frequency difference will be shown with inverted sign.
Otherwise, the frequency of the LO should be at least 2kHz away from the input frequencies, to avoid the noisy lower part of the sound card spectrum. The LO frequency does not need to be accurate, because it's contribution gets subtracted out in the result, but it helps if it is stable (synthesizer, xtal osc.)
There are cheap Chinese synthesizer boards, based on Analog Device's DDS and PLL chips, available on Ebay, that are ideal for this application. Just search Ebay for "DDS", "AD9851", "ADF4351", etc.
Up to table of contents
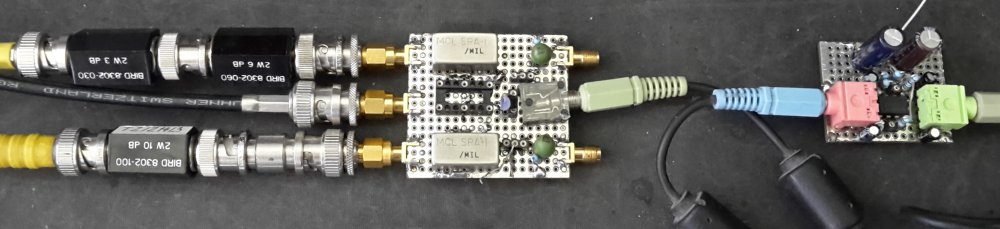
First attempt at downconversion
At first, I just dug two SRA-1 mixers out of my junkbox, connected their LO
inputs directly together, and their IF outputs directly to the sound card line
inputs, trying too keep everything passive, no supply voltage needed.
This worked quite OK, but I soon noticed, that with bigger frequency differences, I get a ripple with the difference frequency on my frequency difference graph.
It's amplitude depended on both input and LO signal levels.
More surprisingly, the amplitude of the beat ripple was also proportional to the frequency difference. I guessed this is probably a hint about the cause of this problem, and started thinking.
And it dawned on me, that the problem is crosstalk. Consider this phasor diagram:
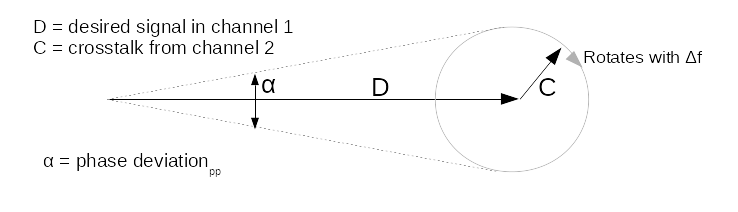
Vector addition of the crosstalk, which rotates with the frequency difference relative to the desired signal, causes a phase wobble of peak deviation alpha. This peak deviation does not depend on the frequency difference, only on the amplitude of the crosstalk.
But the rate of change of phase does depend on the frequency difference, in fact, at constant crosstalk amplitude, it is proportional to the frequency difference. Frcomp calculates the frequency difference by time derivation of phase, so the ripple amplitude is proportional to the frequency difference.
Up to table of contents
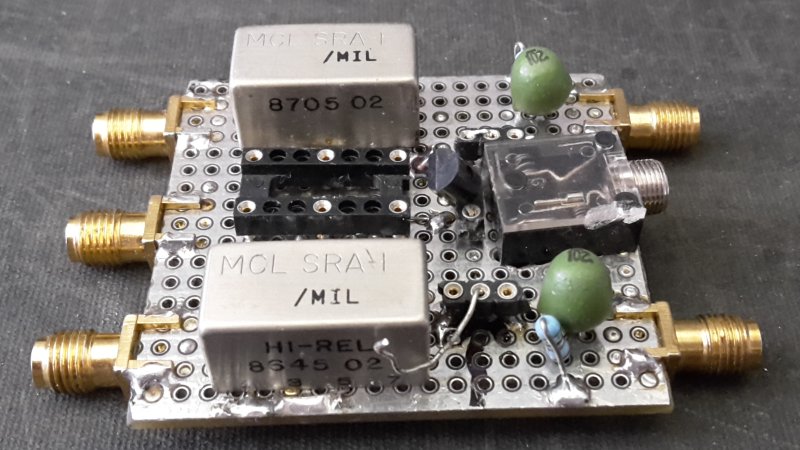
Improved mixer
To reduce crosstalk, I added two simple one transistor isolation amps to the LO inputs. I also added 56 ohm resistors to the IF outputs, to keep the mixer
happy, and two simple LC sections, to attenuate the sum and other high
frequency components, which might cause mayhem in the sound card.
I just stuffed the additional stuff on the original board.
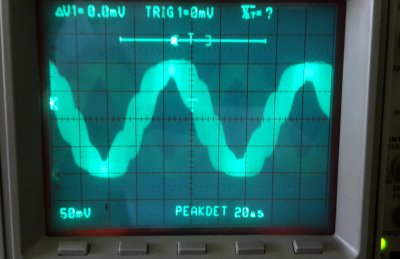
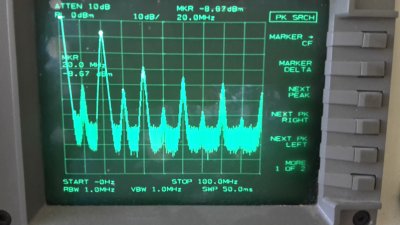
The unfiltered mixer output looked like this:
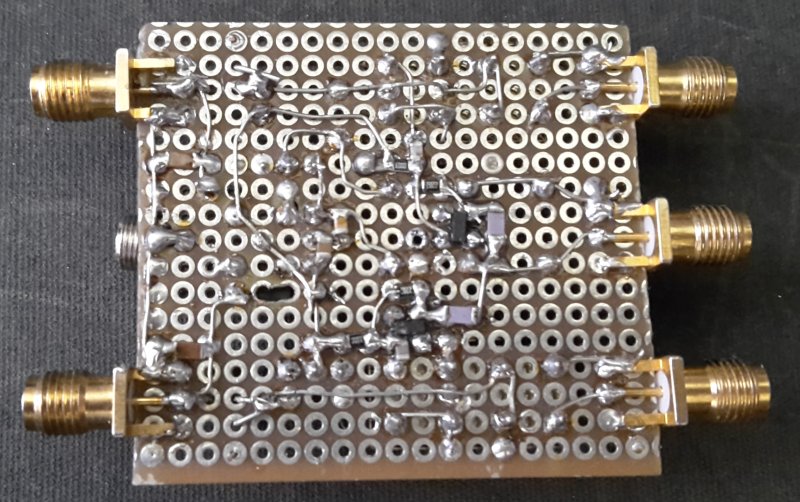
Of course, high isolation is hard to achieve on a proto board. I have used a high end proto board, with a full ground plane on the top, but since I made it quite small in the beginning, I had to squeeze the amps on any spaces left on the bottom side.
3.5mm audio cables with a common shield also do not help with isolation.
The sound card I'm using itself has about 90 dB of L-R isolation on the line inputs, and is not problematic in this sense.
In the end, I achieved some 63dB of isolation between the channels.
While this did not completely eliminate the difference ripple, it reduced it significantly, to the level which is not problematic in most cases. When measuring very close frequencies, it wasn't a problem anyway, and with higher frequency differences, it can be further reduced by averaging of appropriate length (multiple of difference period).
When measuring two audio signals with the same frequency difference, directly connected to the sound card inputs, this beat note ripple does not come up, so obviously it is an artefact of the mixing board.
The best solution would probably be to put each mixer, together with it's LO and IF amplifiers, onto its own board in a separate box, to get best isolation.
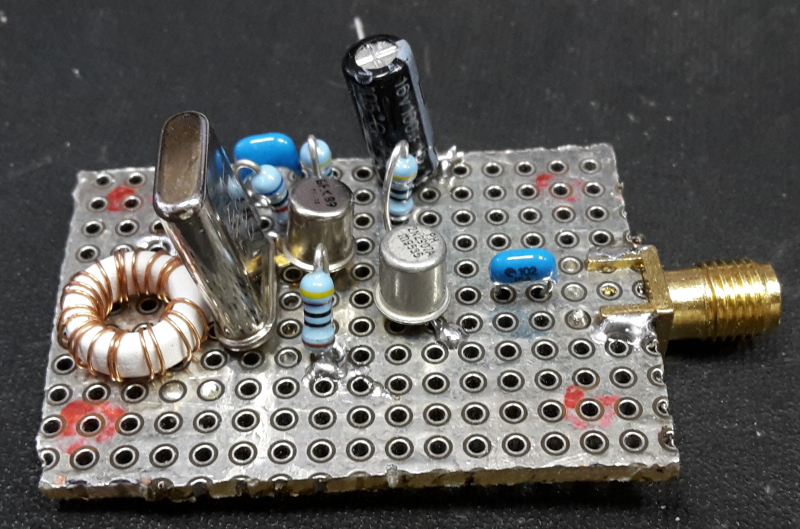
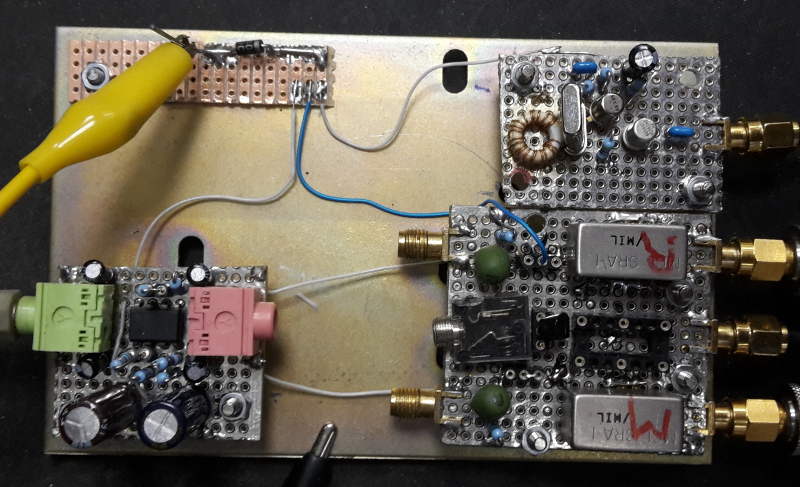
For now, it looks like this, top:
and bottom:
The black socket with most pins removed is for an on board oscillator, and the to92 package is a 5V regulator for it.
The optimum level at the LO input is about -4 dBm, minimum -5dBm. More than 0dBm is not recommended, because the single ended aperiodic LO amplifiers will start to saturate and output a non-symmetrical (not 50% duty cycle) waveform, which will increase the conversion loss of the mixers by a couple of dB or so.
Up to table of contents
How about dividing instead of mixing?
When mixing with the same LO, the relative phase is preserved. One degree
of phase at 10 MHz is converted to one degree of phase at 10 kHz. One degree
of phase at 10 MHz is 0.28 ns, one degree at 10 kHz is 280 ns. The mixing
thus gives us a kind of "time stretching", making possible very precise
measurement.
On the other hand, frequency division will also "divide phase", so one degree of phase at 10 MHz becomes 0.001 degree at 10 kHz, making measurement much less precise.
Up to table of contents
Audio preamplifier
As mentioned above, my computer needs 5.9Vpp at the sound card line input for
optimum performance. SRA-1 mixers can not provide that. In fact, I had to pump
up the sound card mixer input control almost to the top, to fully drive the A/D.
This makes the sound card more noisy, so I decided to add a simple two channel
preamplifier.
NOTE: Things worked very well without the preamplifier, I just wanted to pull the last drop of performance. A better opamp would probably not help much, because with 20dB of gain, the sound card noise still dominates the TL072. If your sound card is better, or your mixer has a lower output saturation, and you need more gain, AD797 or similar might be better.
NOTE: On a microphone input (laptop), you are probably better off without this preamp.
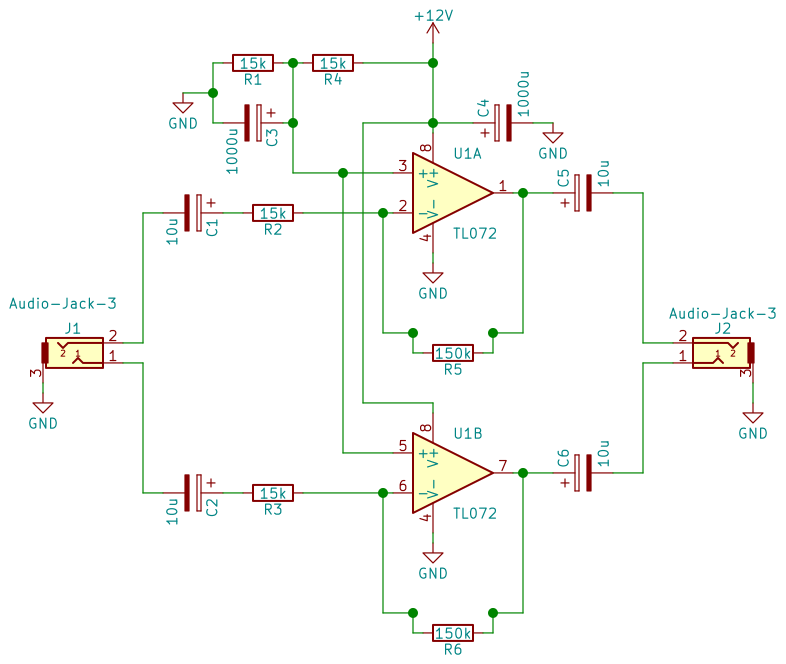
This is the schematic of the preamp:
And a photo:
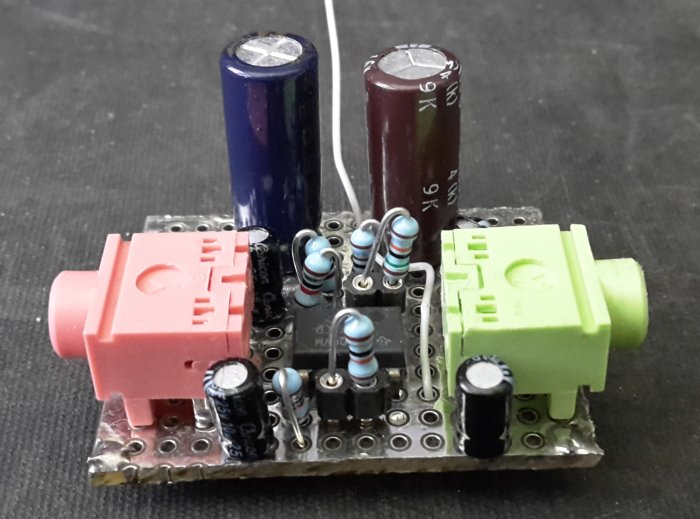
The 15k input resistors are approximately equal to the sound card input impedance, and the feedback resistors are socketed, to allow gain adjustment. With 150k feedback, the gain is 20dB, just enough, on my computer, to fully drive the A/D with the sound card mixer at minimum. The whole setup now looks like this:
Up to table of contents
Influence of LO (in)stability
In theory, the LO frequency should completely cancel out, but in the real world,
the symmetry is never perfect.
To check, how well the LO frequency is cancelled out, I used an HP6840B as the 9.99 MHz LO, and 10 MHz from an HP8656 split into the two inputs.
The 8640 has an external FM input, which can be switched to DC mode. I fed it from the HP33120 and set 100Hz pp deviation.
When making an abrupt frequency change, there is a disturbance on the frequency difference graph, but it only lasts for a few measurement points.
Frcomp basically measures phase, so first I checked how the phase measurement is affected by FM on LO.
The noise on the phase measurement, with no FM on the LO was like this: (note that I have polished the software up a bit in the meantime)

modulating the LO with 0.5 Hz and 100Hz deviation caused about 35 microradians pp of phase error:

Modulating with 1 Hz and the same 100Hz deviation, gave the same error amplitude:
Next, I checked the error in frequency difference. Here is the noise, with unmodulated LO:
Frcomp does frequency measurement by phase differentiation, so the error will also be proportional to the modulating frequency. Modulating with 0.5, 1 and 2 Hz:

gives about 20, 40, and 80 uHz pp frequency error.
There is some tearing in the screenshots, because drawing was not double beffered, so each screenshot can be from two consecutive frames.
With even higher modulating frequencies (or deviations), cycle skips in the phase can occur, wrecking the measurement:
I think any reasonably clean and stable LO source should be OK for this application.
It is important, that the cable lengths from the LO splitter to the mixers are of equal length - otherwise, frequency fluctuations of the LO will be converted into phase fluctuations. This is bad, because frcomp is based on phase measurement.
Up to table of contents
A simple 9.99 MHz local oscillator
Since I did most of the measurements on 10MHz, I decided to make a small
dedicated 9.99 MHz local oscillator, to avoid the need for the bulky
signal generator.
The simplest solution would be just a simple quartz oscillator. But 9,99 MHz crystals are not very abundant, so I decided to use an ubiquitous 10MHz crystal, and pull it down a few kHz.
This is the schematic:
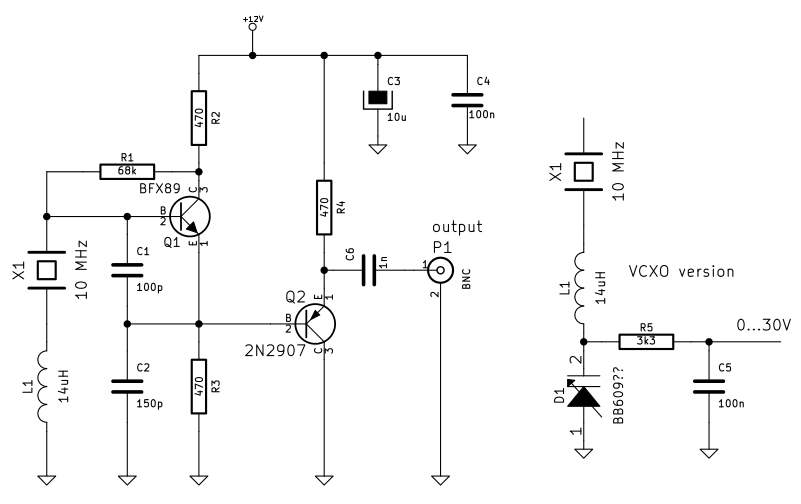
The crystal is pulled down by the series inductance L1. It's value will depend on how far you want to pull, and also on the properties of your crystal.
I have used an old 10 MHz crystal made by IMP Belgrade, Yugoslavia. I could pull it down 10 kHz with about 14 uH of series inductance, which I made by winding 22 turns onto an Ferroxcube TN9/6/3-4C65 toroid (RS components 174-1229).
Since the exact frequency is not important, a 12uH fixed inductance would also be adequate, or make an adjustable coil with one of those Neosid or CoilCraft kits.
NOTE It is important for the coil to be mechanically stable. I wound the toroid a bit loose, and got frequency jumps each time I touched the oscillator board. Soaking the coil with a soft (rubber based) glue solved the problem, by fixing both the wire to the core, and the core to the board.
10 kHz is quite a brutal pull, it might not be possible with every crystal. An 2kHz or 5kHz pull will be enough, just don't go below 2kHz, where sound cards start to be noisy.
Putting an BB609 (I believe, an unmarked component from the junkbox) varicap in series with the coil, as shown on the right of the schematic, I could make an 10MHz +- 5kHz VCXO.
The circuit above can simply be modified to have two outputs, for separate mixer boards, by just adding a second emitor follower, fed from the same point (Q1 emitor).
The output is about +3dBm, slightly high for the improved mixer circuit, also not a nice sine wave, causing a dB or two of signal reduction (see the improved mixer section above).
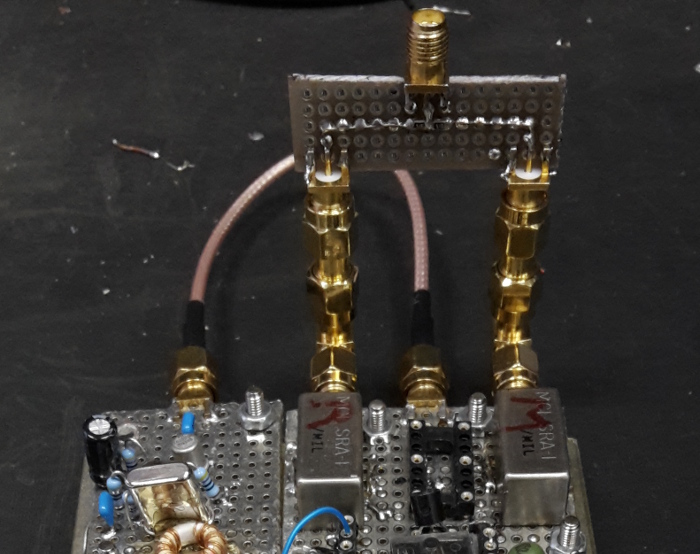
Update 15 dec 2021: By simply mounting the three boards on a small metal plate:
I practically got rid of the difference beat! Good grounding is your friend!!
Most of the measurements on this page have been made before I made this mod, so some of them still contain the difference beat. But since it doesn't significantly change the results and conlusion, I di not bother to redo theose measurements
Up to table of contents
Some measurements
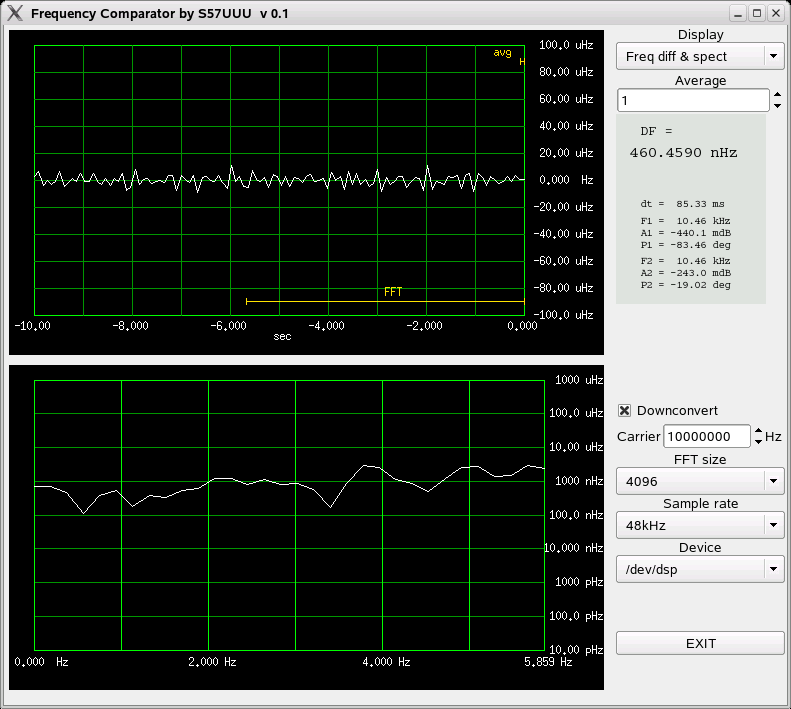
10 MHz reference outputs of two HP5350B counters
I borrowed a couple of HP5350 counters, with rear panel reference outputs,
to get some stable RF signals.
One of them has option 001 (oven time base, 5E-10/day ageing), and the other option 010 (high stability oven time base, 1E-10/day ageing). The short term stability of both is specified at 2.5E-10 per second.
I found their reference outputs differ by about 0.65Hz, or 0.65E-7, more than I expected, but then, these are quite old boxes.
The relatively big frequency difference means we'll get some beat ripple (see the section about mixers above). These boxes aren't mine, so I could not just take a screwdriver to bring them together.
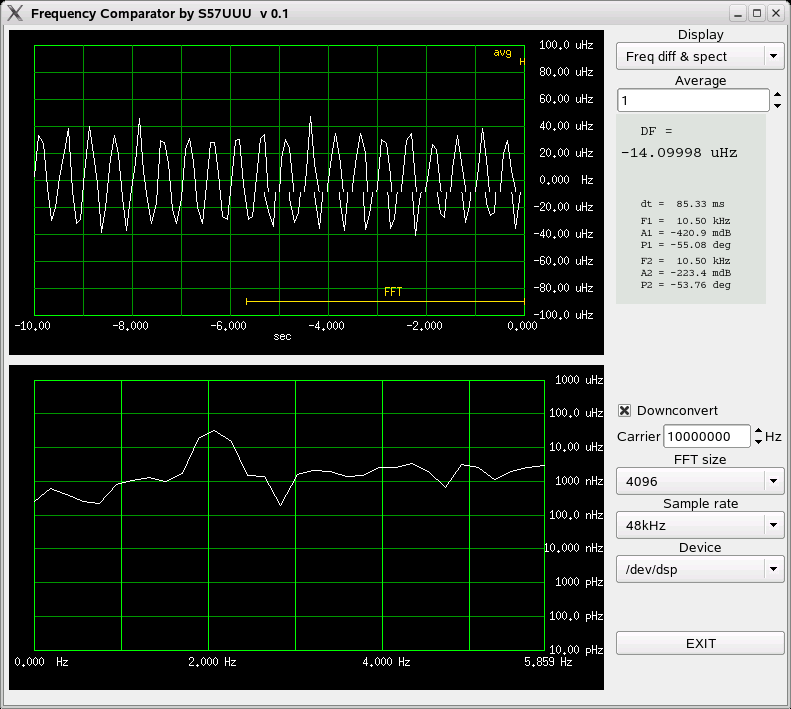
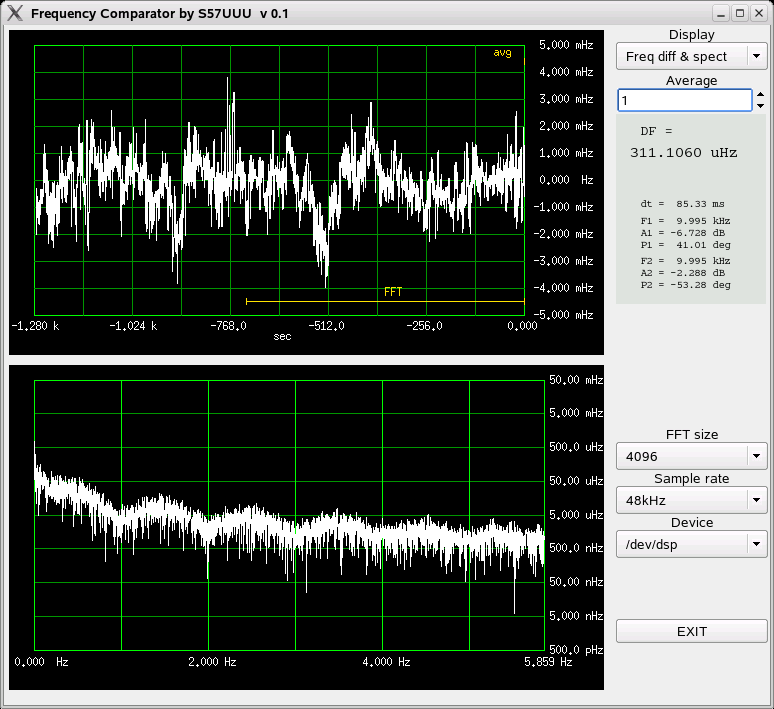
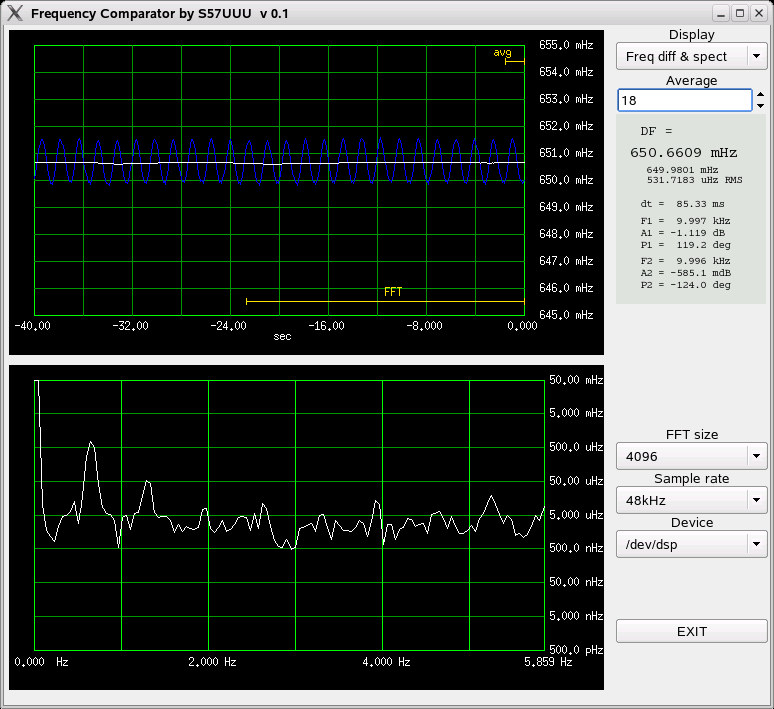
Below is a short term (40 sec) plot of the frequency difference:
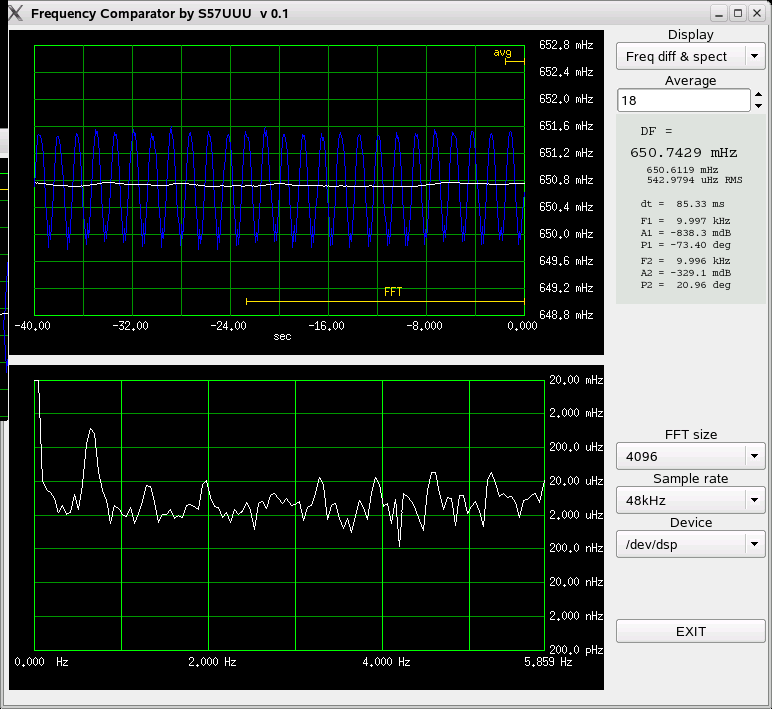
The blue curve is the non-averaged data, where the beat note can clearly be seen, also the bump at 0.6 Hz on the spectrum graph below. The vertical scale is 400 uHz per division.
By setting the averaging to 18, which approximately corresponds to the beat period, we can practically get rid of the beat frequency ripple (white curve). The yellow "avg" line top right indicates the length of the averaging window, and the yellow "FFT" line lower right the samples, from which the spectrum graph below is calculated. This has nothing to do with the "FFT size" control on the right, which is for the input FFTs (see block diagram above).
The vertical scale on the spectrum indicates how much deviation does one FFT bin worth of bandwidth cause. I guess I'll have to normalize that to 1Hz.
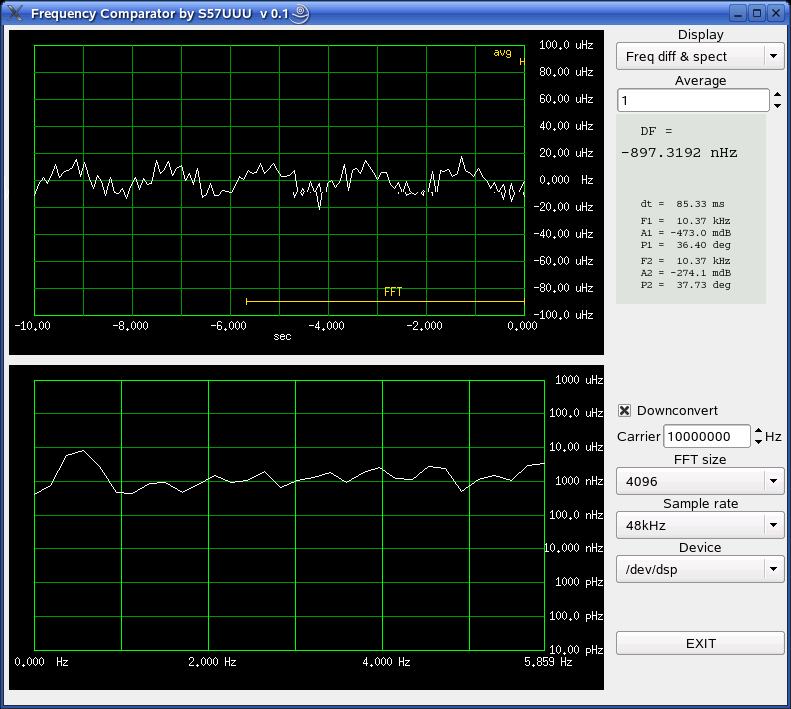
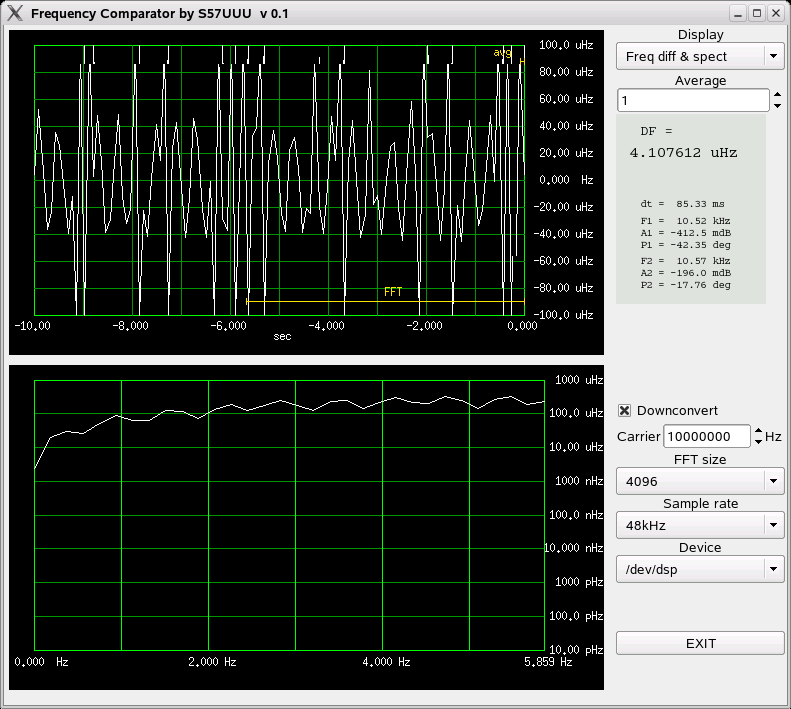
Expanding the vertical scale to 20 uHz per division (2E-12/div at 10 MHz), we can see that during the 40 seconds, the frequency difference is stable within maybe three divisions, or about +- 30 uHz, corresponding to +- 3E-12 relative at 10 MHz. This is of course the sum of both deviations. Assuming they are uncorrelated at this time scale, one must be at least 3dB better:
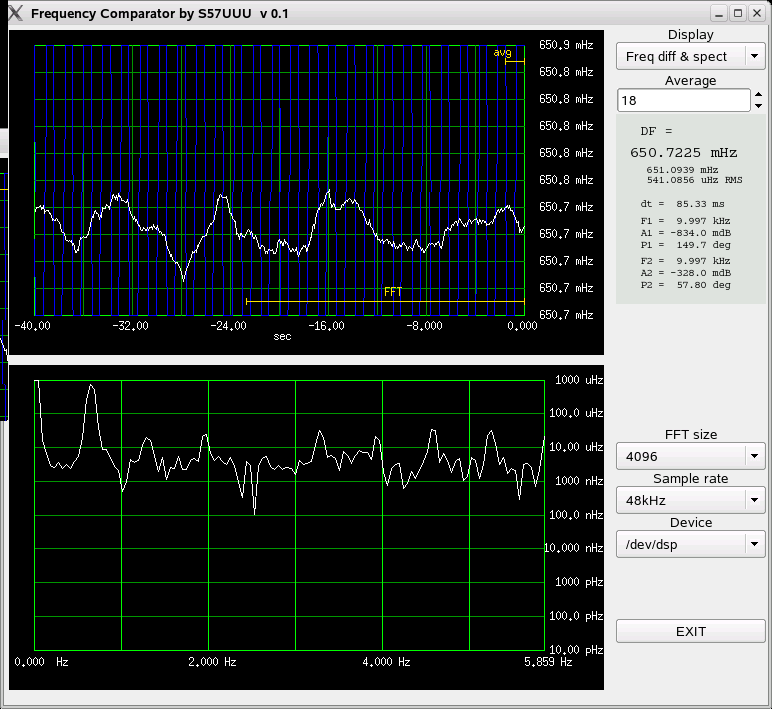
Note that the scale change (multiplication) has resulted in a vertical shift (addition) on the logarithmic spectrum display.
To check the longer term stability, I left the measurement run for a couple of days:
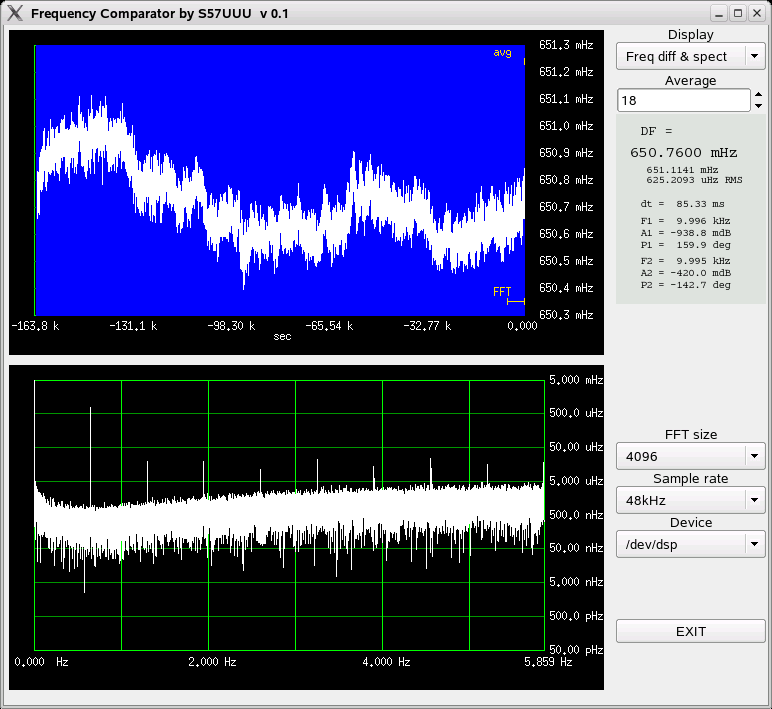
The non averaged data now makes a solid blue background. The vertical scale is 100 uHz/div (1E-11/div at 10 MHz), so the difference is stable to approximately +- 300 uHz or +- 3E-11 relative at 10 Mhz. There is a hint of the day/night temperature cycle visible in the graph. The ambient temperature of both boxes is of course correlated (practically the same, one box sitting atop the other), so we can not assume that individual deviations are smaller than the difference, as we did above for the short term deviations.
Up to table of contents
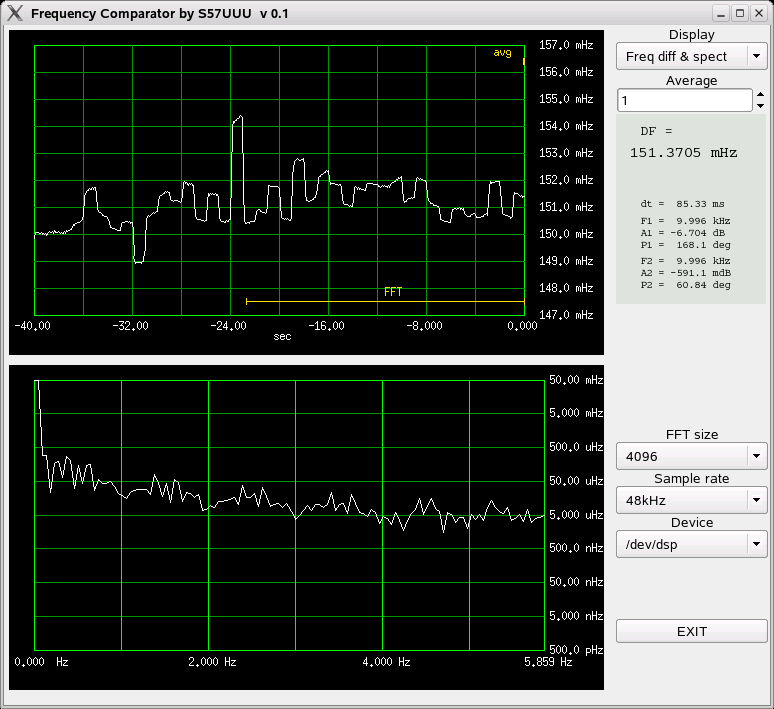
Oscilloquartz OSA 4530 GPSDO vs HP5350B 10 MHz reference output
Next I borrowed an Oscilloquartz OSA 4530 GPSDO, to check the counters.
But the results were a bit strange:
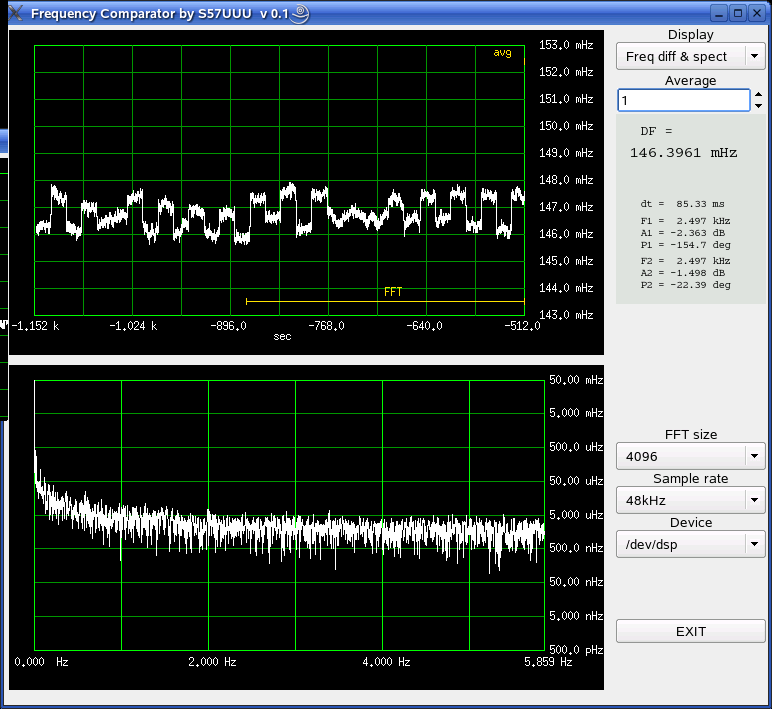
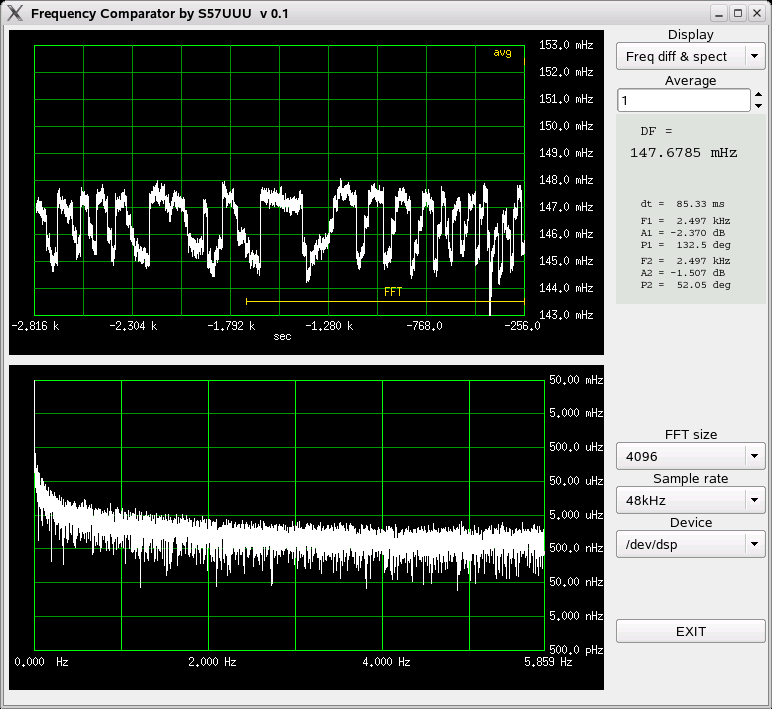
WTF??? The steps are between 1 and 2 mHz (1E-10 to 2E-10 at 10 MHz), could the OCXO controlling DAC in the GPSDO really be that coarse??
In the second measurement, it looks like quantization error on a sine wave?
The "square wave" period is a few minutes, so the peak is not visible on the spectrum, since it is pegged all the way to the left.
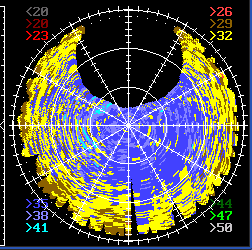
According to Lady Heather, the sky coverage was excellent, and the signal levels were OK, maybe a bit low, due to long cable and power divider.
Assuming the GPSDO frequency is more or less accurate, the fixed frequency offset of around 150 mHz is due to the freely running HP5350 OCXO.
Note also, that at this smaller offset, the difference beat is practically gone. I mean not just longer period, but much smaller amplitude.
Update 24 aug 2021: After some more long term measurements, I found that those jumps happen just about 10% of the time, otherwise the OSA is quite a good GPSDO. I haven't yet figured out under what circumstances the jumps happen.
Update 15 dec 2021: I think I figured this out. OSA seems to discipline the OCXO using the 1 PPS pulses with no "sawtooth correction", like most amateur designs. I really thought it implemented something more sophisticated :-)
The effect comes from the "sawtooth" error, caused by the 1PPS pulses being derived from the non-synchronized receiver clock. If this clock is close to the correct frequency, the sawtooth becomes slow, and the disiplining loop's time constant is not long enough to filter it out. So, the disciplined output is more accurate, when the receiver clock is LESS accurate!!
Up to table of contents
Trimble 57963 GPSDO vs HP5350B 10 MHz reference output
To see how a different GPSDO behaves, I hooked up a Trimble "uccm"
style GPSDO, type 57963-B.
It uses an Trimble 65256 OCXO, 5V type, date code 1410, as the disciplined
oscillator.
And I was again in for a surprise:
Looks like it updates the EFC DAC every second, by pretty large steps. In the short term, this certainly does more harm than good, as these steps are bigger than the OCXO drift in the same one second interval. Since smaller steps are also visible, this is probably not a problem of coarse DAC resolution. Looks more like they do no (much) averaging across the 1PPS measurements, and the 1PPS time scatter gets in large amounts passed to the DAC.
I guess a longer time constant in the disciplining loop would be better.
Also, look how fast the jumps are, more or less as fast (probably faster) than the 85 ms sampling period. I would expect a bit of an analog time constant between the DAC and the EFC input?
Maybe a cracked capacitor on the board? Those Chinese salvage men do not seem to handle these things very gently!
Up to table of contents
Trimble 57963 GPSDO vs Oscilloquartz OSA 4530 GPSDO
Comparing the two GPSDOs, in the short time graph (not shown here), mostly the "teeth" of
the Trimble unit are visible.
On the longer time graph, it looks like the average frequency error is around zero, as it should be, and it is being kept within plus minus 4 mHz, or 4E-10 at 10 MHz.
The 1Hz Trimble update rate can clearly be seen in the spectum as 1Hz wide humps.
Just for comparison, how much cleaner free running OCXOs can be, here are the two HP5350s, at the same 1mHz/div scale as the GPSDO plots above:
Back to the two GPSDOs, their mutual phase, during approximately one hour and half, behaved like this:
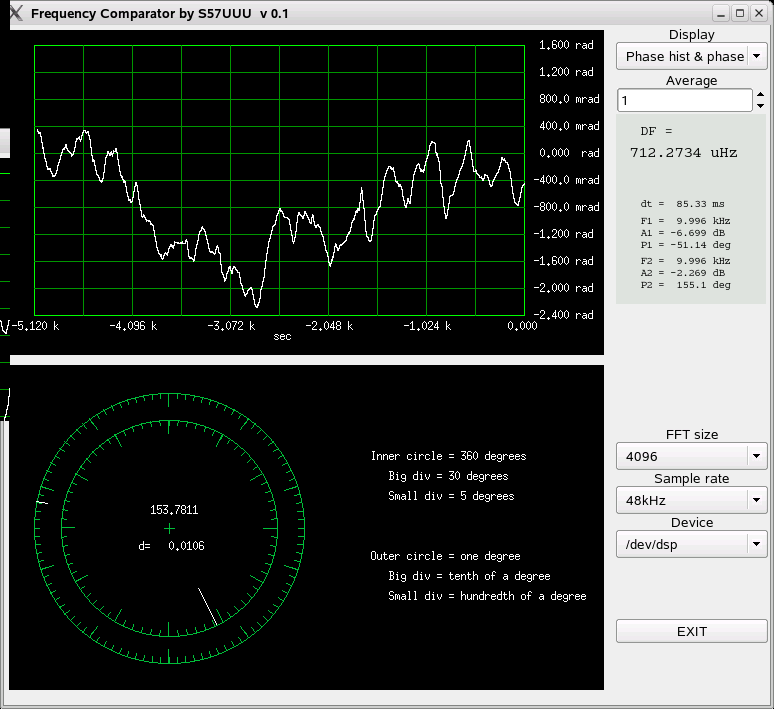
Since these are just disciplined (not phase locked), some phase drift is expected.
In the above graph, covering about an hour and half, they stayed within 2.8 radians peak to peak. One radian at 10 MHz is about 16 ns.
Back to frequency difference. I wanted to check if the Trimble's "teeth" really come from the disciplining loop. I disconnected the GPS antenna at about two divisions from the left here:
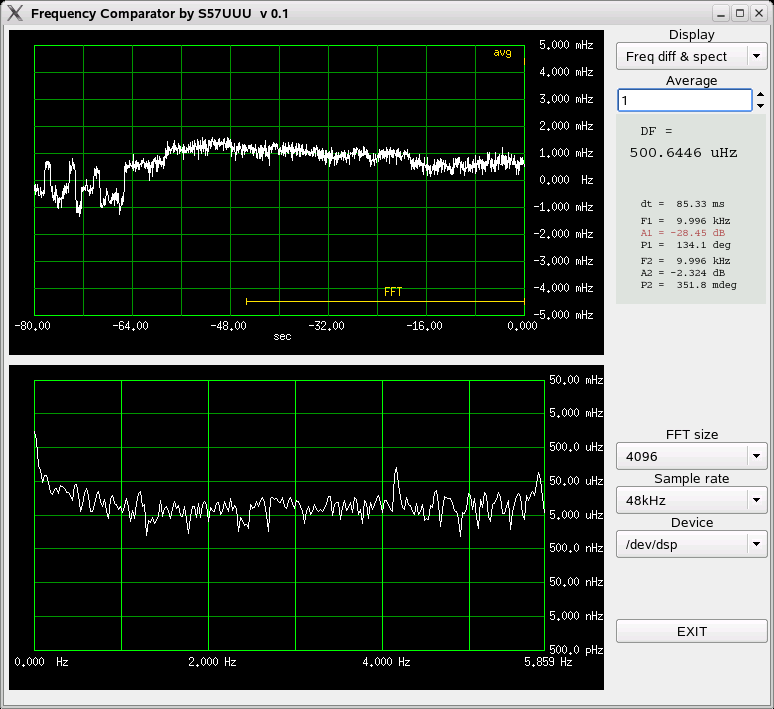
and the "teeth" were gone. A slower loop would really be better here.
Note that in the meantime (five day warm up), the output level of the Trimble GPSDO, for unknown reasons, fell by more than 30 dB (note that A1 is displayed in red). Was 50 ohm too much load and it died?
By removing the 10 dB attenuator, I could still get good measurements, albeit with slightly more noise.
Update 24 aug 2021: I got a second Trimble GPSDO of the same type, hooked it up, and it shows the same behavior. So I think this is by design, not a broken cap.
Up to table of contents
CellSync 1100 GPSDO vs Oscilloquartz OSA 4530 GPSDO
I bought this box in 2001 at a surplus store in Silicon Valley. I was not
able to get any data about it. When I connect the antenna, after a few minutes,
it goes into "blinking green" mode, not sure what that means. I thought it was
doing the survey, but after one week it is still blinking.
Playing with disconnecting the antenna from the CellSync, and reconnecting it after a few minutes, I got this:
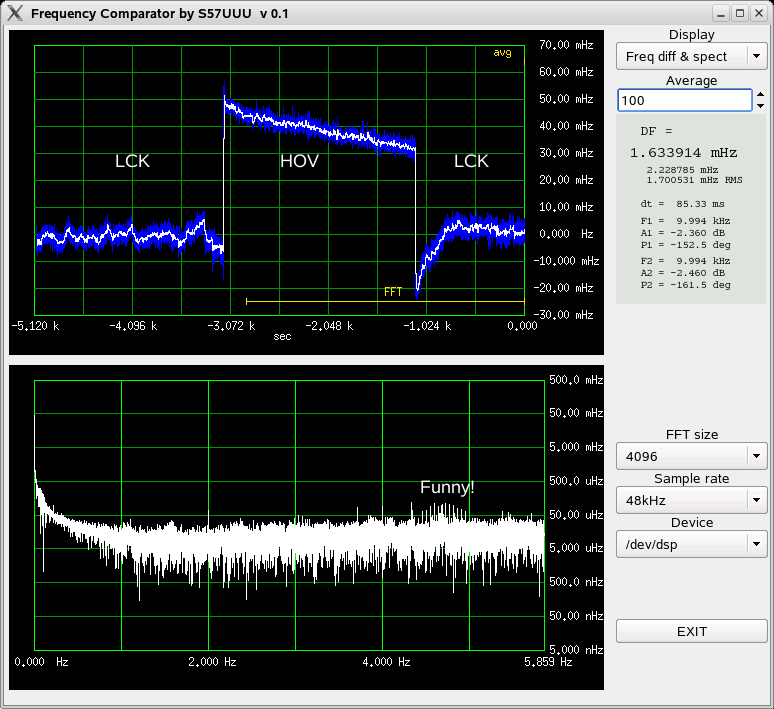
When locked, it dances around zero, so disciplining seems to work. But no idea why the big jump upon antenna disconnect? When the antenna comes back, it does the same size jump in the other direction, meaning that it returns to the last good EFC value. But why does it not keep it during hold over?
When gaining/loosing the lock, a relay click can be heard from the box. Does it just switch the EFC to a fixed value?
From the transient upon re-lock, the speed and damping of the disciplining loop can be estimated. This one does not seem to spoil the OCXO as much as the others. But the dancing around zero is still a few mHz, so maybe the OCXO is of lesser quality.
The "funny" stuff is only there during hold over (HOV).
Up to table of contents
Phase noise and Allan deviation
Since we are measuring phase, which is just another measure of time, we are on the top rank of the Allan and Daams hierarchy [1],p8 [3], and we can calculate all other things, like phase noise and Allan deviation.
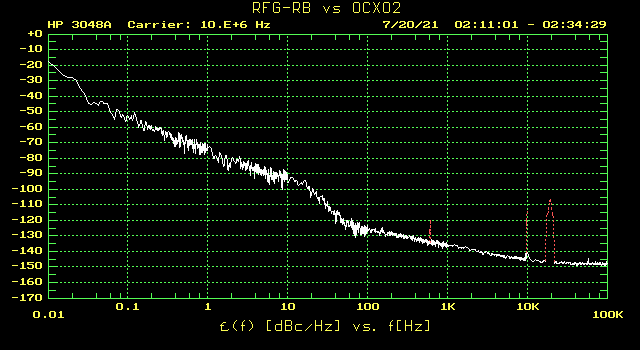
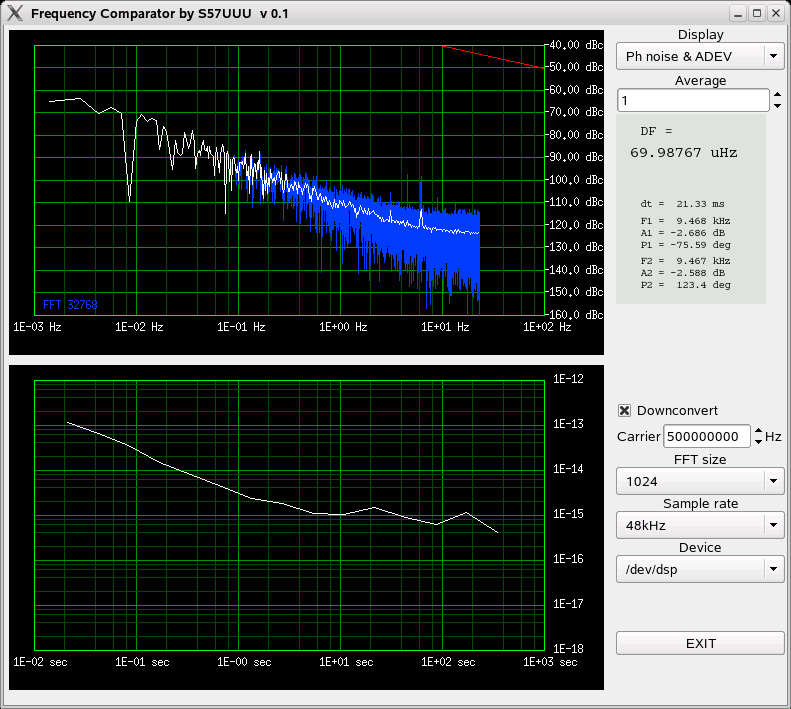
Frcomp does both. Below is an example of a measurement between a Trimble 65256 OCXO and a Lucent RFG-RB rubidium reference. The slanted red line marks the limit of validity of the L(f) = Sph(f)/2 equation [2],p21. Values above it are not accurate.
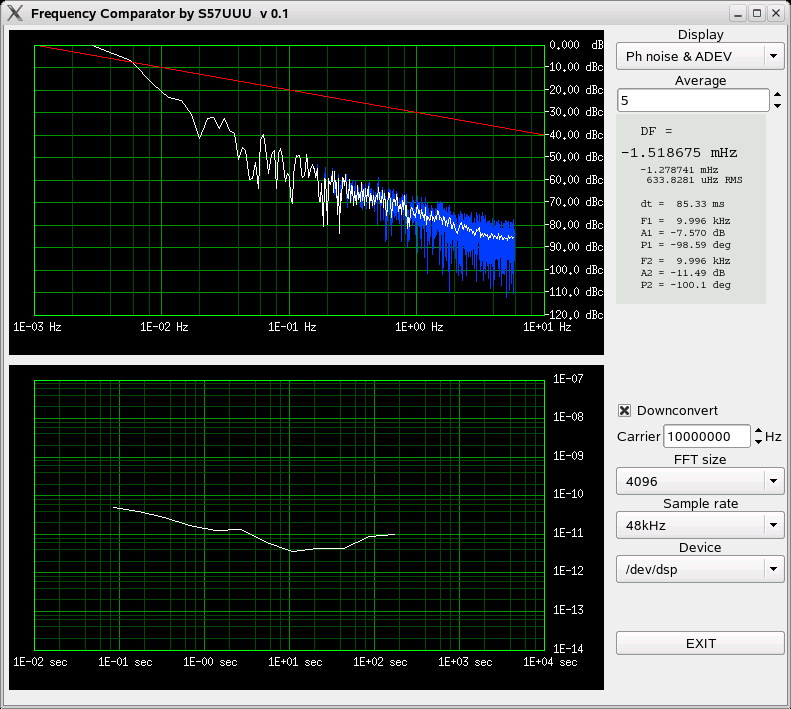
The phase noise plot agrees quite well with my HP3048 setup:
I'm not so sure about the Allan deviation, have nothing to compare to. Could still be some bug in ADEV calculation, beware! The measured values seem plausible, but in the version used here, I was averaging only 100 points, so the uncertainty is rather high, and the curve wandered up and down, as new samples come in.
Currently, the pahse noise measurement only works well, if the two sources are within a few mHz of each other. A bigger difference will "intrude" into the graph as a big hump.
I do plan to make a kind of software PLL, to shift one of the sources to zero beat, but not sure, when I'll find the time.
Up to table of contents
Noise and stability
There is already a noise floor test described above in the audio measurement section, but I decided to look into this in more detail.
Instead of the default 4096, I have set the FFT size to 1024, to be able to see the phase noise up to higher frequencies, and ADEV to smaller intervals.
Note that here we are measuring at the twelfth decimal place and below, and any mosquito flying by, can affect the measurement. I found that even just blowing into the cables, caused a measurable phase wobble!
Up to table of contents
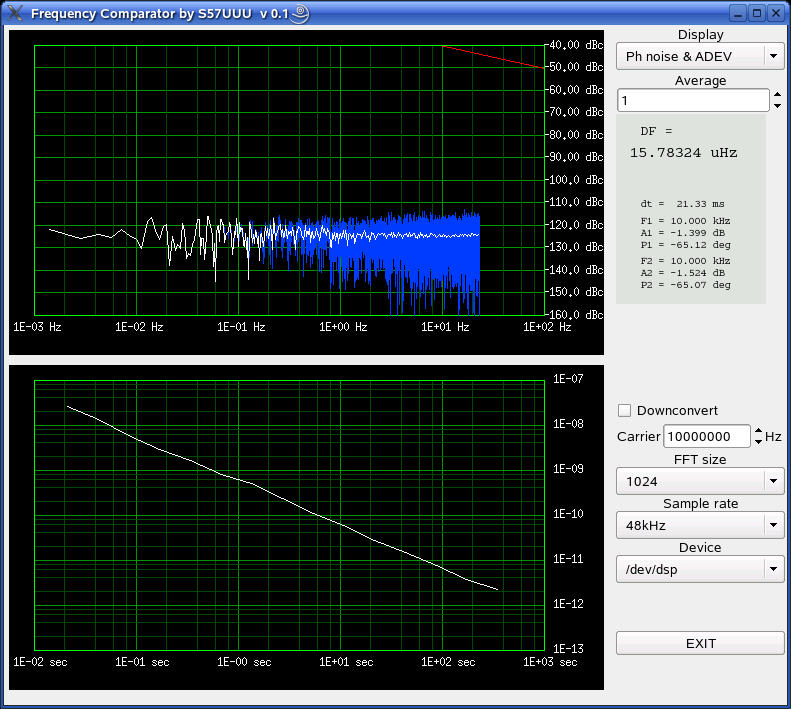
No downconversion (audio frequency input)
Connecting the 10 kHz output of the HP33120 in parallel to both sound card channels, with the sound card mixer at max gain, and the 33120 set to 400mV, to fully drive the ADC, the result is this:
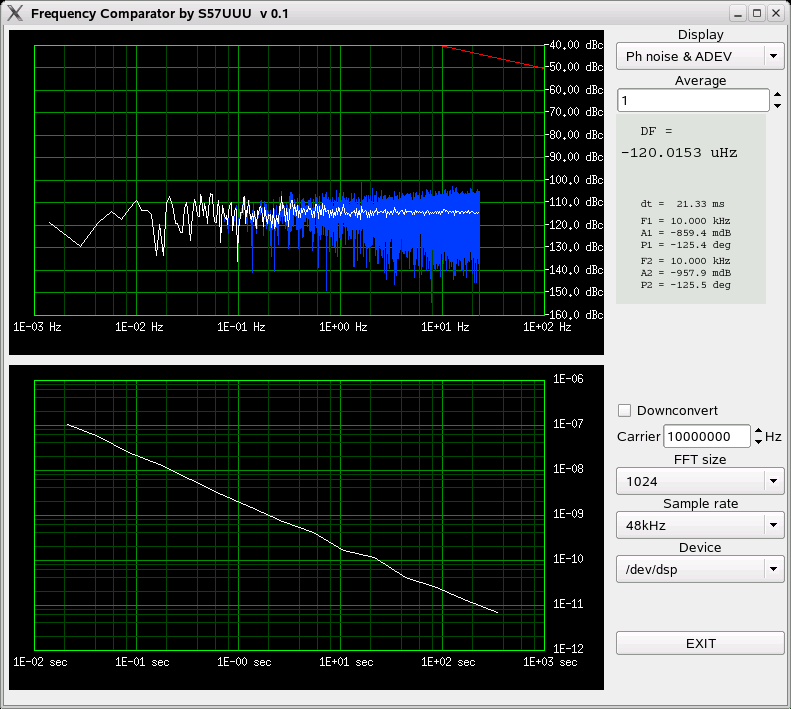
Note that the "Downconvert" checkbox is off, so the "Carrier" input has no effect, the measurement is at 10 kHz, as can be seen in the data window.
The Allan deviation falls with 10dB per decade, because with flat noise, longer integration proportionally reduces deviation.
The non-averaged noise seems to get bigger with frequency, but that is just a statistical artefact. As more frequency bins are combined into each pixel, the probability of bigger deviations increases.
Setting the sound card mixer to minimum, and increasing the amplitude to 5.9V, we get about 12dB of improvement at higher frequencies:

Next, I inserted the audio preamp described above, and set the sound card mixer to minimum.. The required amplitude, to fully drive the ADC, is now 500mV, and the noise is reduced over the whole band:
The noise at higher frequencies is now a couple of dB higher than with 5.9V and no preamp, meaning that the opamps are already contributing some noise.
To check, how much the low frequency noise of the sound card degrades the measurement at lower frequencies, I repeated the measurement with 5.9V and no preamp at 2 kHz:
and 500Hz:
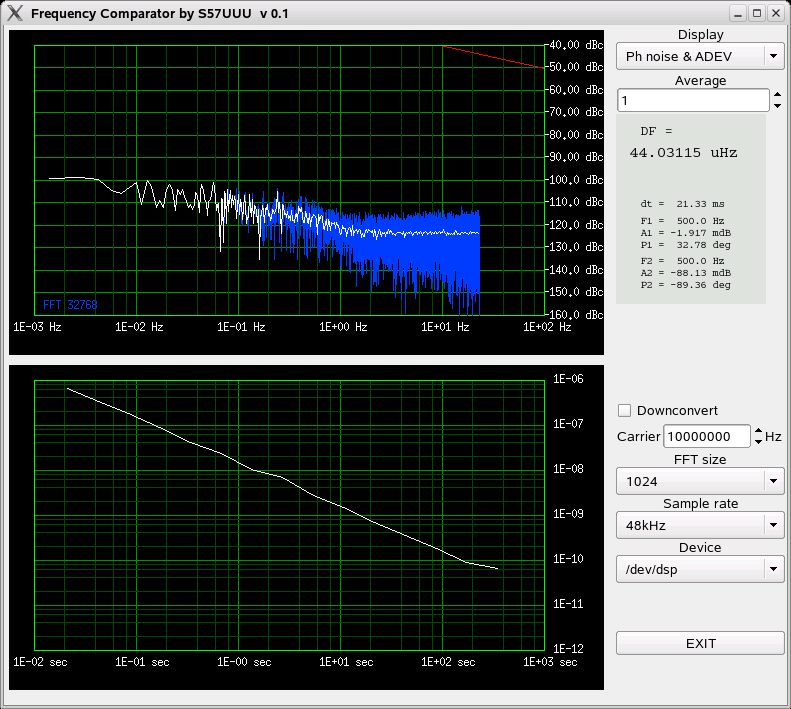
At 2kHz there is almost no degradation. At 500Hz there is a slight degradation at higher offsets, and a significant one at lower offset frequencies.
As expected, the Allan deviation curves are higher at a lower frequency, because the same phase offset corresponds to a longer time.
Up to table of contents
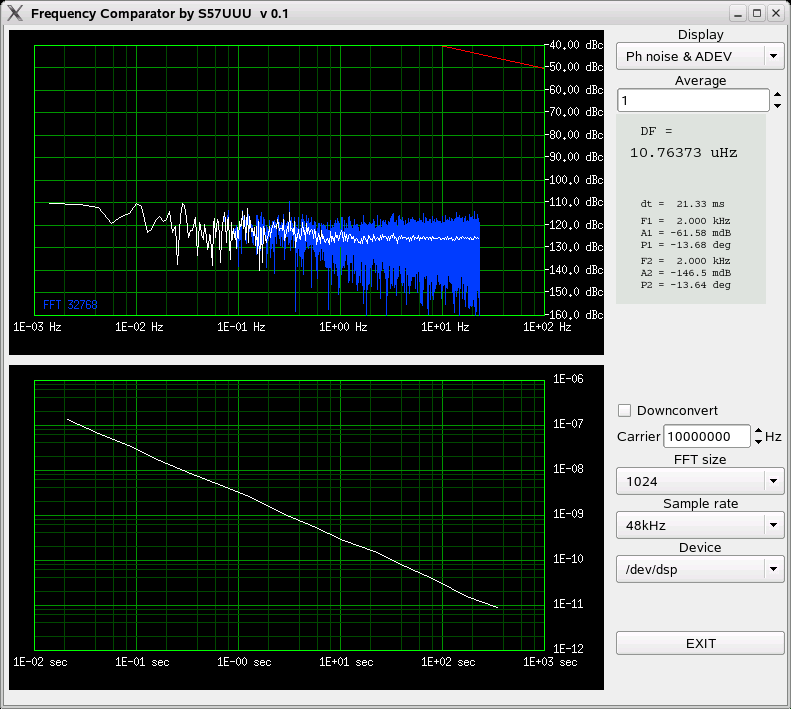
10MHz with downconversion to 10kHz
For these measurements I used the complete setup (mixers + audio preamp). An HP8640 served as the LO, and the 10 MHz from an HP8656 was split with an HP11667A, and fed to the inputs with a couple of equal length cables.
Output of the 8656 was set to 14dBm, which gives about 7.5 dBm at the mixer inputs, to fully drive the A/D with sound card mixer at minimum. 7.5dBm is a lot for SRA-1, but it caused no problems, since we have a single CW signal. Harmonics are no problem, because the input FFT filters them away, only the bins around the max peak enter the measurement.
By optimizing the audio preamp for dynamic range, one could probably work with weaker input signals.

There is a significant increase of noise below about 0.8Hz. HP8656 is a somewhat noisy source, so I decided to check by using the ref output of an HP5350 as the 10MHz source The results were more or less the same. I have tested the preamp (see above), and it didn't have so much 1/f noise. This noise seems to be the product of the mixer?
Up to table of contents
10MHz with downconversion to 2kHz
To see, how much the noise degrades with a lower IF, I set the LO closer to 10 MHz, to get a cca 2kHz IF:
As expected from the AF measurements, the noise is about 3dB higher.
Up to table of contents
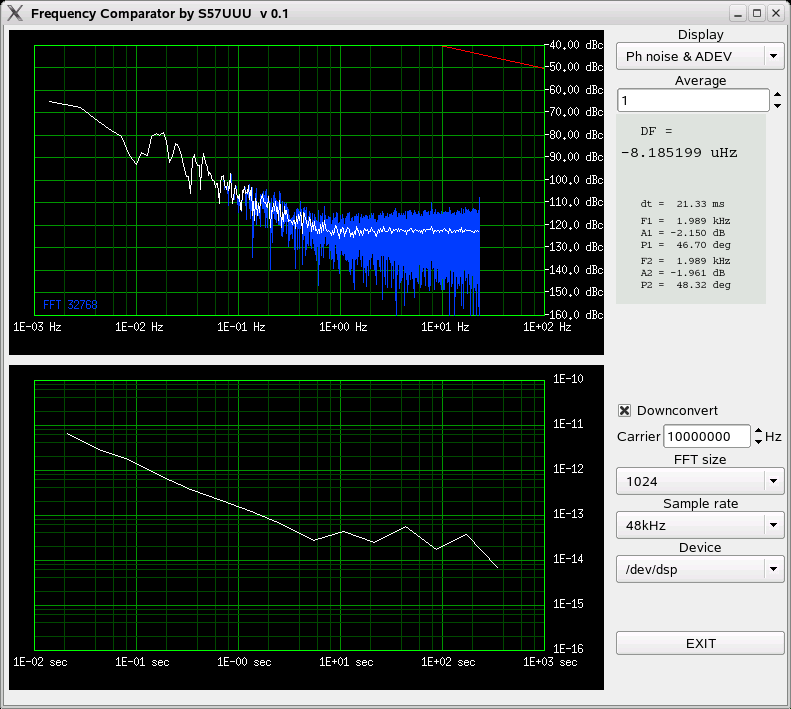
500MHz with downconversion to 10kHz
To see how Frcomp handles higher frequencies, I have set the generators to the upper frequency limit of the SRA-1 mixers:
The 1/f noise corner has moved to higher frequencies, otherwise no problems.
Up to table of contents
The $%^#*%$@@ cables!!! (update 15 dec 2021)
At my first job, in the early 80's, I measured stuff up to 18 GHz on an HP8410, and it had special HP "flexible hands": rigid lines with rotary joints, for phase stability. Later we used special Gore and Suhner test port cables, etc. So, I should have known better... But at 10MHz, what could go wrong, RG58 should be perfect!
After all of the above measurements, I went to check the noise floor again, splitting a 10 MHz signal and bringing it to the mixer inputs via two approx 1m long RG58 cables. After a longer run, I noticed that the spurs in the frequency graph were more frequent when I worked on and around the table. I touched one of the cables, and BANG, a huge spike! Switching to phase history display, I saw that a very sligh touch caused a jump of a few milliradians at 10MHz! Also, after any more substantial movement of the cables, they needed quite some time (minutes) to stop jumping and drifting.
So, are the above RF measurements all crap? I hope not completely, because I always tried to let things alone during the measurements.
Anyway, here I was testing frcomp more than the sources themselves. If anything, frcomp is better than shown here.
Later I made a simple power splitter on a protoboard, that can easily be connected without cables, to re-check things.
It seems the measurements weren't that bad, anyway, I always took care not to touch stuff during measurement.
Up to table of contents
Conclusion
Considering the simplicity of the hardware, the results are surprisingly good:
1. Frcomp is sensitive. I have yet to lay my hands on an oscillator, whose instabilities are not well above Frcomp's noise floor. Of course, it's measurements are relative (it is a comparator), so your absolute accuracy is limited by your reference oscillator.
2. Frcomp is fast. It can see the action of GPSDO disciplinig loops, and can be used to quickly tune OCXOs, etc.
But beware, to get the performance described here, you need a quality sound card with line input and low crosstalk between L and R channels. Most laptops only have a mic input, and the newer ones even just a mono mic, because they use the combined mic+earphone 3.5mm socket.
If using the mic input, you probably don't want the preamp described above, and your optimum RF input levels might be lower.
In any case, switch to the input spectrum display, and try to tweak your gains and levels for maximum S/N.
Note that the hardware described here (mixer, 9.99MHz LO, audio preamp) is all just improvised with available parts from the junkbox, on protoboards, therefore in no sense optimal.
The measurements were done with the boards on the desktop, no shielding, no boxes for thermal and mechanical stability, etc.
Up to table of contents
Software Download
I plan to publish the source code under the GNU GPL license, once I make it a bit more presentable.
For now, here are some binaries:
32 bit, compiled on Suse 9.3
64 bit, compiled on OpenSuse 15.0
64 bit, compiled on Ubuntu 18.04.4
Up to table of contents
(a sort of) User Manual
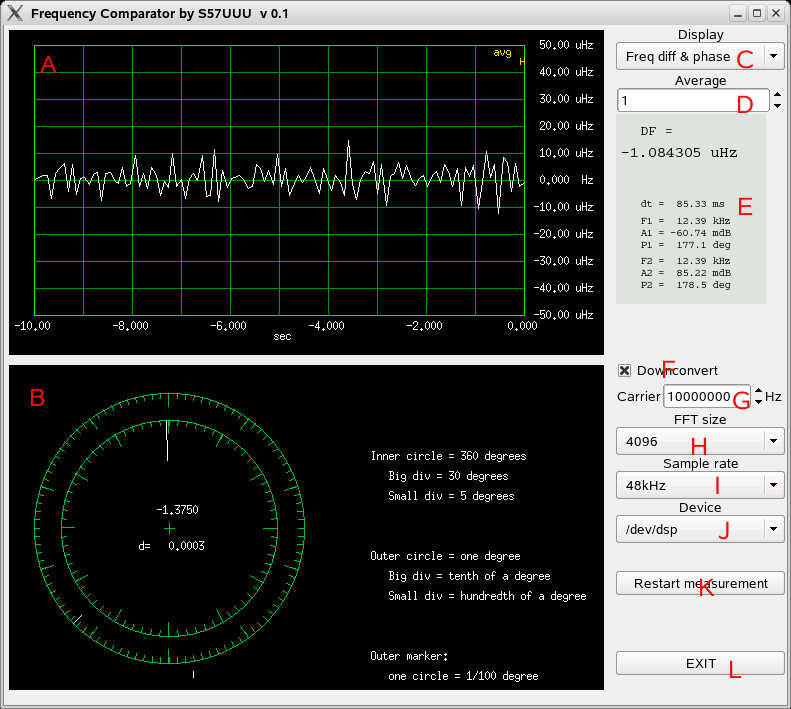
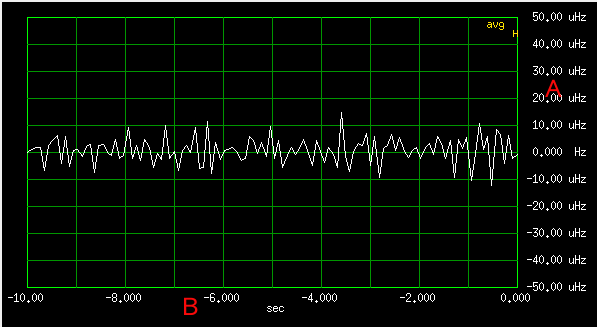
A = upper graph. Displays frequency difference history, input spectrum, phase history, phase noise.
B = lower graph. Displays phase, input spectrum, frequency difference spectrum, Allan deviation.
C = selects what is displayed in upper and lower graphs. Available options are: Frequency difference history and momentary mutual phase, input spectrum of both channels, input spectrum zoomed around the highest peak, frequency difference history and it's spectrum, mutual phase history and momentary value, phase noise and Allan deviation.
D = amount of averaging for frequency difference history, phase and phase history. When >1, the non-averaged data is displayed in blue. On the phase noise graph, averaging varies across the time scale, and is set automatically, according to the amount of acquired data. For the Allan deviation, averaging increases with new data coming in, but is limited to 10000.
E = data area, displays frequency difference, post FFT sampling interval, plus frequency, amplitude and phase for each input channel. The frequency difference is shown in red, if the phase step (frequency difference) is to big to use the phase differentiation method, and frcomp switches to center of gravity method. In that case, you can try to decrease the FFT size or increase the sample rate. Channel amplitude values outside of recommended range are also shown in red.
F = check this, if external mixing is used.
G = input frequency to the external mixers. This is only used for Allan deviation calculation, to convert phase to time. If "F" is not checked, this has no effect.
H = select the size of the input FFT (see Frcomp block diagram above). Use smaller FFTs to see fast events, bigger FFT for lower noise. Changing FFT size will restart the measurement, erasing all previous data.
I = select the sound card sample rate here. Not all sound cards support all sample rates. What is worse, many will silently accept a value they can't provide (a "feature" of ALSA etc.), and serve you garbage. I would prefer even if the system would crash on illegal sample rate request - but this is today's software: put blinds on the user, pinch his nose, and feed him shit. 48000 Hz is the safest bet. Changing the sample rate will restart the measurement, erasing all previous data.
J = select the OSS sound card device here.
K = restart measurement. If you move the cables, and get a nasty spike, which throws off your averaged measurements, click this. Warning! All data accumulated until this point will be lost!
L = quit Frcomp
The scale on some of the graphs can be adjusted with the mouse wheel.
Wheel alone changes the scale, SHIFT+wheel shifts the scale. The vertical scale is changed in the area to the right of the graph "A", the horizontal scale in the area below the graph "B".
On the phase noise and Alan deviation graphs, the horizontal scale is automatic, and will change according to the amount of data accumulated. The vertical scale can only be shifted up or down.
Up to table of contents
References
[1] D.A.Howe, D.W.Allan, J.A. Barbes: Properties of Signal Sources and Measurement Methods
Proceedings of the 35th Annual Symposium on Frequency Control, 1981
Reprinted in [4]
[2] HP RF & Microwave Phase Noise Measurement seminar 1985 proceedings
http://www.hparchive.com/seminar_notes/HP_PN_seminar.pdf
[3] D.W.Allan, H. Daams: Picosecond time difference measurement system. Proceedings of the 29th Annual Symposium on Frequency Control
[4] Characterization of Clocks and Oscillators, NIST Technical Note 1337, pp TN17...TN18
https://archive.org/details/characterization1337sull