I got SIDI v1.1 running on the desktop shortly after new year 2005, but the winter was qiute severe and long this year... I'm not a fan of winter sports (or any other kind of winter outdoor activities) so the "real sky" test had to wait.
Mid March the snow melted and the temperatures became bearable, so I went to Pavle's place and we set up the new receiver with the old antennas and preamps.
Because we remembered the "jammer" problems from the past, we decided to first try finding a clear frequency, now that SIDI had frequency agility.
But using the "quasi spectrum analyser" program we found the whole L-band polluted! We suspected that the preamps oscillated wildly, however experiments with dummy loads proved that this wasn't the case.
Then suddenly, a little before Pavle's wife went to bed, the spectrum was suddenly much clearer! We waited and did some more testing, but all stayed clear. Before wrapping it up, Pavle went to check the weather report on TV, and suddenly the jammer was back! I told him to switch off the TV and Bingo!!!
The problem proved to be his satellite TV receiving system. Apart from the dish with the LNB, there was a line amp for the long cable and a diplexer to bring in the signals from a terrestrial TV antenna. The diplexer was bad, and the terrestrial antenna was transmitting the whole satellite IF band...
It was really a triumph to have caught the "Big Bad Jammer", but some more broadband trash remained - much weaker, but still detectable.
Then it dawned on me that keeping one antena (small dipole) fixed, taking the other in my hand and moving it around a little while watching the phase on the circular correlation display, it should be possible to determine where a signal is coming from. If the antenna moves towards and away from the source, the phase should change in nice circles, and when moving the antenna in a plane perpendicular to the source direction, the phase shouldn't change at all.
Well, at least that was the theory. In practice the phase is very sensitive to ANYTHING - if I left both antennas fixed and just moved my body a little, the phase ran circles...
But with some perserverance and exquisite coreography, I was still able to track the source down. Hm, I was really stupid - the culprit was of course the very laptop used to run the SIDI software :-(
After putting ferrites on all cables and stuffing the whole thing into a metal suitcase, the air was finally clear and we were ready for the real tests!
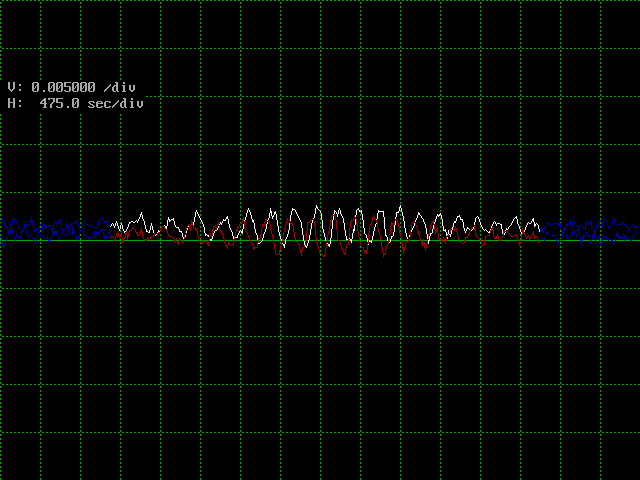
For the first experiment, I choose the Moon as a target. The fringes with averaging set to 100 should be just at the level of noise, so I planned to extract them using FFT (like the Cygnus observation with SIDI v 1.0)
During the observation, visible fringes suddenly started to appear!
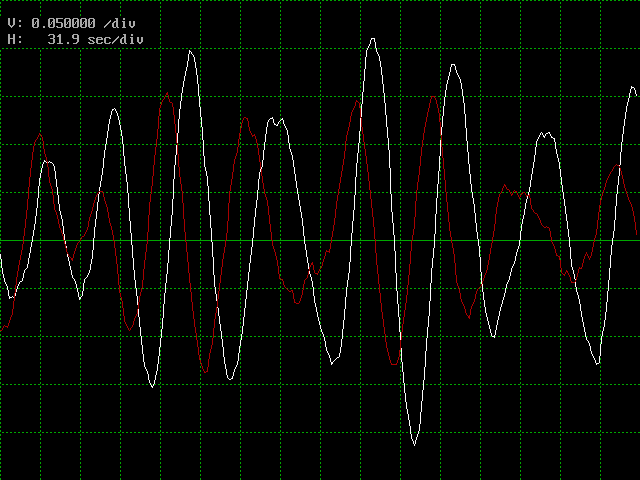
When I later checked the fringes:

it became clear that the fringes were too fast (about twice) for the baseline, meaning that the source moved faster than Earth rotation alone. Most probably a satellite "intruder"!
Loking hard, one can see a hint of some slower fringes in divs 4 and 5 (approx 1 fringe/div) - I guess that is probably the Moon, before it was swamped by the satellite (which has cca 2 fringes/div).
The center frequency was 1264.29 Mhz and the bandwidth cca +-200kHz around that.
Any idea what kind of satellite that could have been?
Anyway, that gave me the idea: why not try to intentionally get some fringes from satellites?
GPS satellites seemed a good choice, especially because Pavle happened to have several small commercial active GPS antennas.
The cca 1 MHz wide GPS C/A pseudo random spread spectrum signal will look like a nice point noise source to a receiver with less than a MHz of BW - and SIDI 1.1 has cca 400kHz of BW.
GPS receive antennas are made to cover the whole sky (hemispherical beam), so they will always receive more than one satellite at a given time.
Setting the frequency to 1575.4 MHz and recording for a while gave this result:

Because the GPS satellites move in different directions across the sky and because thay are at different positions in the sky, the effective baseline and therefore fringe frequency will be different for each of them. The result is that the recorded "fringes" make up a complex beat pattern.
As the satellites travel across the sky, these fringe frequencies change, and I thought it would be nice to see how they wander around.
To see that, we left SIDI running through the night, recording the GPS band.
We have put a plastic box over the laptop, to protect it against morning dew, and went inside.
In the morning I pressed a key on the laptop to stop the recording - and it made a "circular saw" type of sound as it tried to spin up the hard disk! After a few such hair-raising false starts, it did come up, and the data was saved.
Since then bad sectors are multiplying like rabbits!
The temperature did not even go below freezing during the night - I would understand if a desktop PC would jam, but I really believed laptops were a little more "environmentally resistant" ??
Anyway, I now had a nice long file: mcl5754.csv
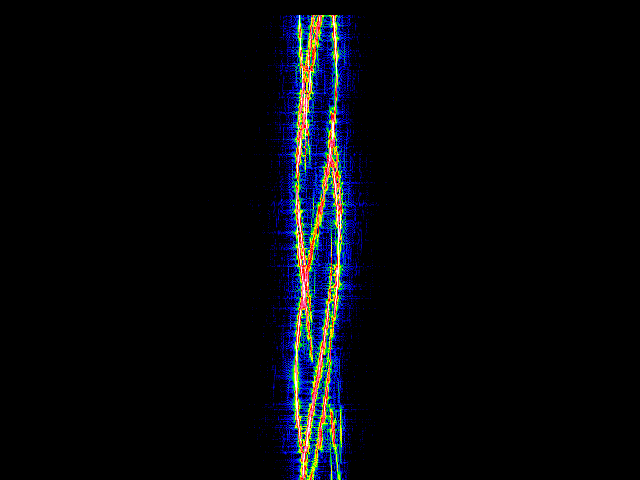
To see the changing frequencies, I made a "waterfall spectrogram" type program: sidi11sh.c
Running it produced this result:

Horizontal axis is frequency and vertical axis is time (increasing downwards).
NOTE - these are fringe frequencies, not the spectrum of the received bandwidth.
The realtively short baseline (cca 25m) caused the fringe frequencies to be quite low (cca 17 mHz or one fringe per minute), hugging the DC (zero frequency) in the middle of the picture.
A longer baseline would make the frequencies wander further, making a "wider" picture.
It can be seen in the picture how the satellites rise and set, their fringe frequencies changing in the mean time.
BTW, because the GPS satellites are quasi ideal point sources, one could lengthen the baseline without the fear that the correlation would decrease!