Getting SIDI up and running
Introduction
I have designed SIDI to be as "no-tune" as possible, but problems can always occur, and electronic circuits seldom work immediately after being constructed.
Here, I will try to describe a step by step procedure for bringing up and testing SIDI. Because the goal is to do it with as little test equipment as possible, the procedure starts at the PC and moves on towards the antenna. This way, most often each working stage of SIDI can be used to test the next one.
Understanding what is going on helps a lot. So I suggest, even if everything goes smoothly, not to just rush to the next stage, but to ponder a little, at each stage, WHY things work the way they do. Try to change something, poke your fingers at the sensitive points, and see what happens, experiment, introduce artificial faults etc. Figure out why, when you do X, Y happens. Experience gained this way can be invaluable, when later something really doesn't work.
1. Basic preparation and needed equipment
1.1 General
Before starting to test SIDI, you need to have a PC that can run the required SIDI software.
You will also need a 12V power supply and a multimeter. An oscilloscope can be handy, but is not absolutely necessary.
For the RF part, you will need a few RF cables with suitable connectors and/or adapters, a L-band power divider and a weak signal source.
Some of the recommended hardware is described in the subsections
below.
Of course, you should prepare yourself the printed schematics
of everything, and paper and pencil to write notes as you go.
Writing down the measured values for later reference makes a lot of sense!
Having printed datasheets of the used chips handy can also help
a lot.
1.2 Computer
1.2.1 LPT/DOS
For the LPT version, it should have a working installation of DOS and Borland C. It should have at least a 100MHz processor. During development, I have used an 266 MHz Pentium MMX for the LPT/DOS version.
The programs run in the conventional DOS lower 640K of memory, the "mem" command should report the "Largest executable program size" of at least 572K. If less, "clean up" your AUTOEXEC.BAT and CONFIG.SYS files, SIDI needs no special drivers.
On the laptop that I use for LPT/DOS SIDI, under DOS 6.2, the CONFIG.SYS file contains only:
DEVICE=C:\DOS\SETVER.EXE
DEVICE=C:\DOS\HIMEM.SYS
DOS=HIGH,UMB
HIMEM allows DOS to reside in "high" memory, freeing more of the lower 640K for SIDI, and about SETVER I am not even sure if it is really needed...
The AUTOEXEC.BAT file is comparably spartan:
C:\DOS\MOUSE
C:\DOS\DOSKEY
path=c:\dos
prompt $p$g
None of these is really needed for SIDI to work, they just make working with DOS easier.
1.2.2 USB/LINUX
For the USB version, the PC should have an USB2 port and a suitable Linux distro, with C programming support (GCC,..), X development libraries and LIBUSB installed. An kernel patched for low latency is recommended (see here:
penguin surgery
), but many measurements can be done with a standard kernel.
For the USB/LINUX version I recommend at least a 1GHz processor. During development, I have used an 2.8GHz Pentium IV for the USB/LINUX version.
1.3 Signal sources
SIDI was designed to work with random noise signals from natural sources, so most tests will be done with noise signals.
Often, the internal noise of SIDI can be used for the tests, but
for some tests an external noise generator is needed.
1.3.1 IF noise sources
In most cases, the noise from the tuners is all that is needed
to test the IF strips. For a still higher higher noise level,
connect a LNA to the tuner input, and a 50ohm load to the LNA input.
The tuner gain control (if available) can then be used to vary the
level of the noise.
In the case that you would like to test the IF strips, and don't
yet have a tuner, you will need a suitable IF noise source.
The discrete transistor IF amplifier needs a relatively high
input level (some mV) to limit, so I have developed a suitable
high level HF noise source for testing it:
A simple HF noise generator.
It produces about the same level of noise as a "Sky Star 2" tuner
at maximum gain, with terminated input.
1.3.2 RF noise sources
Please note that the above described HF noise generator is
suitable only for IF tests, not for tests of the RF stages, because
it only produces usable noise up to a few ten MHz!
An low noise preamplifier (despite its name :-), especially if it has
high gain (like 30dB), can often be used as a RF noise source. Just connect a 50 ohm load to its input, and it will produce 300K*gain of
noise at its output (for example 300000K for a 30dB LNA).
For still more noise, two LNAs can be cascaded, however one has to be careful to check for any self oscillation in this case.
Satellite TV "line" amplifiers for the 900...2100MHz IF (intended for
use between LNB and set top box) can also be used for this purpose.
A bias tee is needed for power supply (via center conductor), and DC
is present at the input, so be careful with the input termination!
An Ku-band satellite TV LNB is also a good source of L-band noise.
The problem is how to terminate the input (waveguide or integrated
feedhorn). If left open, external signals can intrude, if just covered
with metal foil, oscillation is possible.
A bias tee is needed for LNB power supply (via center conductor).
Of course, such noise sources do not produce a calibrated level of noise, and the level produced will be probably quite dependent on the temperature and supply voltage. Luckily, for "RF debugging" purposes, you usually only need "enough" noise, and these sources will do good work at that.
1.3.3 RF narrowband sources
These are not strictly necessary for SIDI testing, but
for some auxiliary measurements, like IF level checking with an
oscilloscope, and checking the synthesizer frequency, narrowband (harmonic, sinusoidal) sources can be used.
The problem with most signal generators is that they produce too much signal. What we need here are very weak signals, and even if the signal generator does have an output attenuator that reads -120dBm or
so, it might not be suitable. Especially old generators, most likely
to be found in an amateur lab, will often leak much more than that!
Here are a few possibilities of generating a low level signal at L-band:
A HF DDS as an UHF weak signal generator
Harmonic generation with an 2M transceiver
Making the N1BWT "Weak Signal Source" REALLY weak
Again, these sources do not provide a calibrated level of signal, but they do provide the signal at a precisely defined frequency.
1.4 Other RF gizmos
For working with SIDI, you will need RF cables, which, dependent on the baselines used, could get pretty long. In this case, you will also probably need some line amplifiers. For in the lab SIDI testing, you will need a power divider etc...
Before building / buying all of these, you should first decide on the connector type to be used - it makes a lot of sense to use a single type of RF connector for the whole setup.
The tuners have officially 75 ohm input impedance, but in the TV business, the tolerances are quite wide. Therefore using 50 ohm cables and connectors for the rest of the system will not cause problems, especially if a longer cable is the first thing connected to the tuner input.
Of course, the best choice would be some "real" RF connector, like N or SMA. Just permanently put an F-to-whatever transition on the tuners, and then build all of your system with the chosen connectors. However, new "real" RF connectors are quite expensive, so if you do not have an ample surplus source of them, it is worth considering something cheaper.
BNC is a cheaper option, however beware of the cheap "computer grade" ethernet BNC connectors.
And since the tuners already have "F" connectors at their inputs, the humble "F" connector is another possibility, and it will allow you to keep all of your system at 75 ohms.
I know that the seasoned interferometrists will squeak with horror, because the electrical length of the "F" connectors is totally undefined, and their connection repeatability is nonexistent - but many interferometric experiments can be done nevertheless, there is no problem getting fringes with them, just the phase calibration will be questionable.
Another advantage of the "F" standard is, that cheap line amplifiers, power dividers, low loss 75 ohm coaxial cable etc, can be easily bought everywhere.
2. Computer interface
First we need to check whether data can flow between the SIDI and the PC, since all subsequent tests rely on that. The procedure depends on whether you are using LPT or USB interface. Both procedures are described in the subsections below.
2.1 LPT version
First check if the computer is fast enough to achieve a suitable
sample rate. Run the program
lptchks.c.
It should measure at least 500k samples per second. If you get less,
the computer is not suitable. The problem is either the CPU or a slow port.
Your computer might achieve the required sample rate, but still be slow for correlation. In this case, SIDI will work, but the sensitivity will be less, because more samples will fall into the bit bucket.
I have done most of my LPT SIDI work on an 266MHz Pentium MMX laptop.
To check individual input pins of the port, run the program
lptchki.c.
It will continuously display the state of the input pins. If you have nothing connected to the LPT port, it will print something like HHHLH, representing the logic state on pins 10,11,12,13 and 15.
Now use a thin wire, one end connected to PC ground (chassis or pins 18..25 on the LPT port), and poke the other end into holes 10,11,12,13 and 15 on the female D25 LPT port connector on the PC. The corresponding "H" should change to a "L".
For the pins, which are originally "L", a logic ONE is provided on pins 2...9 - use this to try changing the "L" pins to "H".
If all tested well, plug in the cable that you will be using with SIDI, and repeat the test at the other end of the cable, paying attention to which pin affects which input. You would be surprised how
many electronic problems are due to bad cabling!
Next, run the program
lptchko.c.
It will toggle the output pins 2 and 3 on the LPT port, which are needed for the I2C interface in SIDI. Use the multimeter to check the voltage at these pins, referred to PC ground. On pin 2 it should be one second high (cca 5V) and one second low (cca 0V), and on pin 3 it should be two seconds high and two seconds low.
Again, check at the other end of the cable too.
If any of these checks fail, the most probable reason is that you are not using "pure" DOS. These programs use direct hardware register access, and modern operating systems frown upon that. In this case, you might get it working by manipulating the permissions in your OS.
Another possible reason is, that you have some fancy modern port, setup for an advanced ECP or EPP or whatever mode. Check in your BIOS setup, and set for "legacy" or similar.
Also, your port might not be at the default IO address of 0x378. In this case, change the constant LPT in the all of the test programs (and later in the SIDI software too, of course).
And last, your LPT port might just be simply dead - if you plug and unplug the cable often, with equipment under power, you might just have blown it. If some pins work and others don't, fried hardware is the most probable explanation.
2.2 USB version
The USB version of SIDI is based on my
UUUSB board.
I suggest reading through the description in the above link first, to get a little familiar with it.
You will need a suitable LINUX distro with libusb, GCC and X development support, to compile and run the associated programs.
I provide only the C sources, see the comments at the top of each source file for how to compile it.
Most of the programs will also require an firmware file (*.ihx), which they load into the Cypress chip. Both the *.ihx files and their C source
(for the SDCC compiler) are
included here.
Once you have an UUUSB board ready, plug it into the USB port (MUST be USB 2 !)
and type
dmesg | tail
Among the last lines displayed, you should see:
usb 4-2: new high speed USB device using ehci_hcd and address 6
(The bus numbers and address will probably be different)
It is important that is is recognized by the system as an HIGH speed device ("full" speed is NOT enough!), and
there should be no driver or program coming up and claiming the Cypress device, otherwise the UUUSB board will not work! (see the
UUUSB software description
for details).
To check if all is OK, run the
find_cypress.c
program (requires no firmware), which should detect and report the Cypress device.
MORE COMING SOON!!!
3. The IF strips
Brace yourself, we are going deep into the analog jungle now!
Interference, crosstalk, self oscillation and other ferocious beasts
are waiting eagerly for a meal!
The procedures differ slightly for the TBA120 and discrete transistors
versions of the IF strips. Both are described below.
3.1 The TBA120 based IF strip
3.1.1 Voltage tests
Connect the IF strips to the PC (via either LPT or USB), leave the IF inputs unconnected (just leave the filter sockets empty) and connect the power supply. When 12V is connected to the main SIDI supply, the
voltage at the IF supply terminals will be cca 11.25V.
Check the DC voltages at the pins of the chips. Pins marked with "*" can have a lot of AC, possibly fooling a digital multimeter.
Most of the voltages depend on internal bias circuitry of TBA120, so
they will vary somewhat with different batches of chips.
The DC voltages should be:
TBA120S:			LM319:
pin1:	0V			pin1:	0V
pin2:	cca 1.8...2V		pin2:	0V
pin3:	cca 0V			pin3	0V
pin4:	cca 0.4...0.6V		pin4	cca 1.8...2V
pin5:	0V			pin5	cca 1.8...2V
pin6:	cca 1.8...2V		pin6	0V
pin7:	cca 3.3...3.5V		pin7	cca 2.4V  *
pin8:	cca 6...6.3V		pin8	0V
pin9:	cca 3.3...3.5V		pin9	cca 1.8...2V
pin10:	cca 1.8...2V		pin10	cca 1.8...2V
pin11:	cca 9.2...9.4V		pin11	cca 11.25V
pin12:	0V			pin12	cca 2.4V  *
pin13:	cca 1.8...2V		pin13	0V
pin14:	cca 1.8...2V		pin14	0V
The TBA120S has enough gain to give a significant output from its own noise, but usually not enough to go into hard limiting on it alone.
If you have an oscilloscope, you can check for cca 200mVpp of noise at pins 6 and 10 of the TBA120s, and the same signal on pins 4,5,9 and 10 of the LM319s.
The signal should look like this: (NOTE: these are pics from an analog 'scope, I am not sure what a DSO would spit out...)
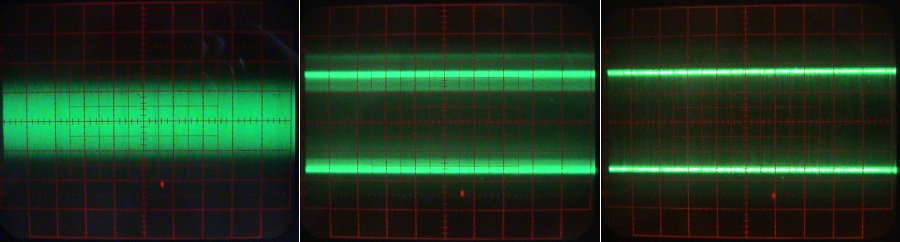
If nothing is connected to the TBA120 inputs, you should get
approximately the left picture. Scale is 100us/div horizontal (not very important) and 100mV/div vertical.
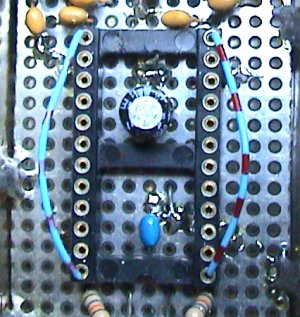
Connecting the tuner (or another IF noise source), without the lowpass filter (make a bypass
like this:)
you should get the center picture - the TBA120 is now in hard limiting regime. The bright band around the top limit is caused
by ringing (bad probe ground), and should ideally not be there.
Inserting the 200kHz LP filter, you should get the right picture above. TBA120 is still in the hard limiting regime, but there are less transitions,
so there is less "fog" between the limit levels.
There should be a random TTL signal on pins 7 and 12 of the LM319s.
For the same three cases as above, you should get approximately this on pins 7 and 12 of the LM319s:
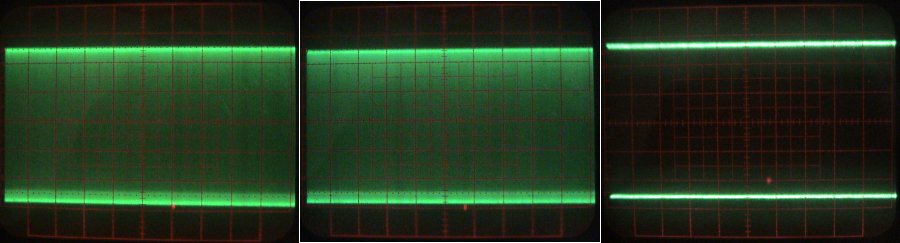
Here, the vertical scale is 1V/div.
3.1.2 Time domain tests
Now, let's check if these signals are arriving into the PC well.
Run the program
sidi1tdd.c
if working with LPT/DOS, or else
xxxx.c
when working with USB/Linux.
(NOTE: the DOS version uses a delay loop to control display update rate - so it will depend on the speed of your computer. Just change the loop near the end of the "main" function, if you find it too slow ot too fast.)
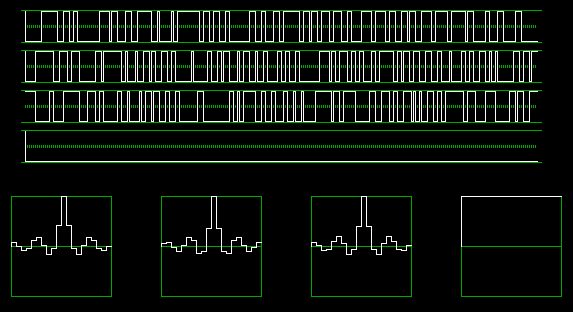
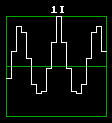
If everything is working well, the display of the tuner noise coming through the LP filters should look like this:

The time traces on top should display random square waves, with about the same average density of transitions in all channels.
The autocorrelation displays should show nice peaks at zero offset (center). The narrower the LP filter, the wider will be the autocorrelation peak, so this can be used to see if the LP bandwidth is well matched to the sampling rate. The picture above is for a 0.7 Nyquist LP (200kHz LP with cca 600kHz sampling), a good value.
It is OK if your autocorrelation plots look a little different from the picture above, the impotrant thing is that they should be as similar among themselves as possible.
If any of the channels looks significantly different than the others, you have a problem and must sort it out. It could be a bad solder joint, interference intrusion, self oscillation etc. BTW, first check that there is really nothing connected to the inputs! These are very sensitive, and a piece of dangling wire can act like an antenna, bringing HF mayhem to your IF!
The FFT program described below can be of some help when checking for interference.
If there is no QRM or oscillation, check the LP filter for that channel, probably one of the component's values deviates.
A totally dead channel will show up as a "flatliner", like the fourth channel below:
In this case, use an oscilloscope to check the TBA120 and LM319 outputs, or of you don't have one, switch the outputs to locate the problem to either IF strip or LPT port/cable.
Especially with the LPT version, when running without the filter, or on TBA noise only, there should be virtually nothing but the central peak, like the first two channels below: (this was done by simply removing the filter from the socket)
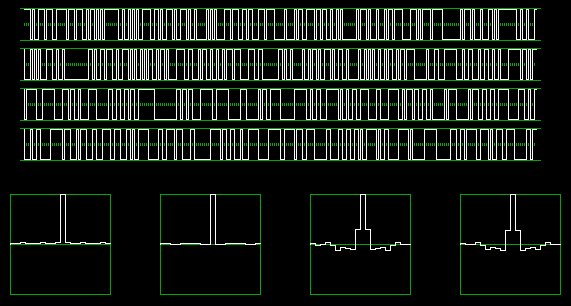
because the bandwidth of the noise is much higher than the Nyquist limit of LPT sampling. (Note also the higher average density of transitions in the top two traces.) You will get about the same picture, if your LP filter has too high cutoff frequency for your sampling rate. Remember your school days: the autocorrelation of white noise is just a single Dirac pulse at zero offset!
Once all of the channels are alive and kicking, their DC offsets should be checked. The DC gauges below the autocorrelation displays show the DC offset on a semilogarithmic scale: the range between -1% and +1% is shown linear in the green part of the scale. The range from 1% to 100% is shown logarithmically in the yelow (1%...10%) and red (10%...100%) parts of the scale.
DC offset checking is best done with filtered noise present at the inputs (LP filters inserted).
This version of the IF strip relies on the symmetry of the TBA120 for low DC offset, there is no adjustment for it. Typically, the DC offset will be below 1%, and anything below 3% can be considered as OK. If the offset in any of the channels is bigger, try changing the TBA120 chip. DC can also be skewed by strong external signals (out of band, too), check the inputs!
The offset voltage of the LM319 comparator does not have much influence with the 200kHz LP filter, because the LM319 is fed with quasi square waves.
Try squirting some freeze spray on the TBA120 and see what happens to the DC offset.
The "quadrature" gauges below the DC gauges show the cross correlation between I and Q of each of the two channels. Ideally, if the tuners had exactly 90 degrees of phase offset, I and Q would be totally uncorrelated, and the gauges would show center scale (zero correlation).
Of course, these readings only make sense, if you have the tuners connected, preferably with some additional noise source at their inputs.
The scale is the same as with the DC offsets, and 1% of correlation corresponds to cca 0.6 degrees of quadrature error.
3.1.3 Frequency domain tests
Next, check the in-band spectrum using the FFT program,
sidi1fft.c
if working with LPT/DOS, or else
xxxx.c
when working with USB/Linux.
This is a complex FFT analyzer, showing the spectrum from minus Nyquist (half of the sample rate) to plus Nyquist, with DC (frequency zero) in the center. Later, when used with the tuner, the zero frequency represents the frequency to which the tuner is tuned (it's LO, because it usess direct conversion). The negative frequencies then represent frequencies below the LO frequency and the positive frequencies the ones above the LO.
With nothing but tuner noise through the LP filters on the inputs, it should look similar to this:
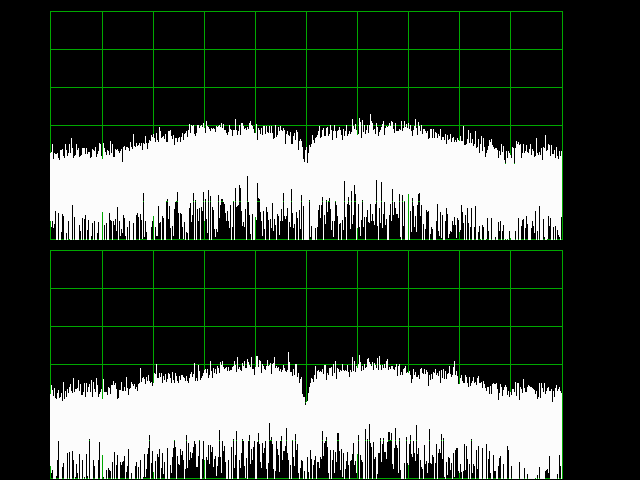
This program is a very bad (tiny dynamic range) spectrum analyzer, because the input samples are one bit only, but it will show any narrowband interference.
If you have some DC offset, there will be a spike at the center, which does not represent interference.
Because the amplitude information is lost in one bit sampling, the characteristics of the LP filter can not be seen, all that remains of it is the slight bump in the noise level.
The sampling routine in this program runs somewhat faster (on some machines) than the one in the original sidi program, so the LP band edge is closer to 0.5 Nyquist than 0.7 in this image.
The dip at the center (zero IF) frequency is caused by the capacitive coupling of the baseband I and Q signals in the tuner.
If you see any interference spikes, like this:
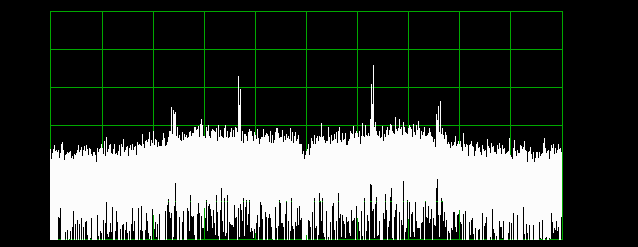
check first for any switchmode supplies around (PC, monitor, other PSUs...) and try moving the devices that contain them,
to see if anything changes. The horizontal deflection of CRT monitors is also a big source of interference, and even LCD monitors have some "hair", because they contain converters for backlighting etc.
Because a QRM signal intruding in the IF is extremely unlikely to impinge into I and Q with perfect phase quadrature, in most such cases the image rejection will be very low, and the IF offender will show as two almost symmetrical (around center) spectral lines.
If you have an strong QRM signal that by itself drives the TBA120 into limiting, you will see this:
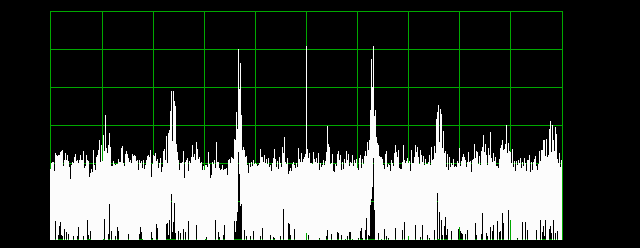
Note the fact, that the saturation has caused a reduction and equalization of the noise level, and produced a DC spike. On the time domain display, it will look similar to this: (your frequency will probably be different)

and if the frequency is high enough, you will also see that the autocorrelation fuction has become periodic:
If you can not find a source of external QRM, and especially if it is very strong, self oscillation of the IF strip is a possible explanation.
This can have many causes, but bad grounding is the most probable. This is a high gain circuit, and you must observe good RF building practices when constructing it, like a lot of well connected ground (and shielding), no long dangling wires, well filtered supply, etc...
3.1.4 Correlation tests
After the band has been "cleaned" of anything but pure noise, we can try some correlation measurements, the essence of SIDI.
To do this, run the "real time correlation display" program
sidi1rtc.c
if working with LPT/DOS, or else
xxxx.c
when working with USB/Linux.
This program displays the complex correlation between the two channels:
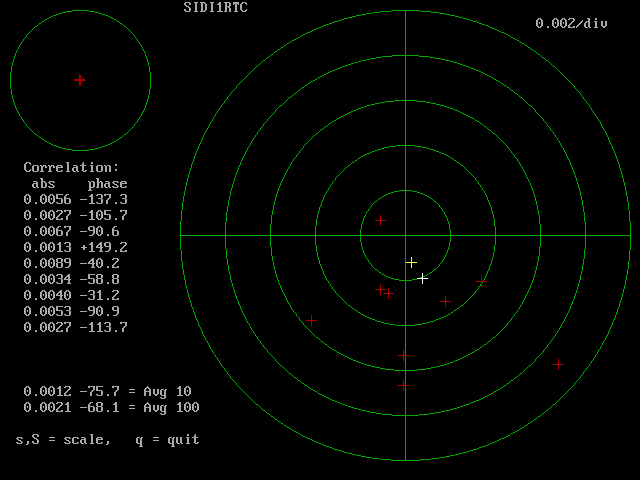
The small circle upper left diplays the whole circle of radius 1 in the complex plane, and the tiny circle within it indicates the area which is displayed enlarged in the big circle in the center of the display.
The red crosses are the correlation value calculated from one "chunk" of samples each, (128K, or 2^17 samples by default), the yellow cross the average of ten successive chunks, and the white one the average of 100 chunks. These last two only show up after a sufficient number of samples has accumulated. Press s or S to zoom in and out, and q or Q to quit the program.
First we check the zero point, when the inputs are fed with totally uncorrelated signals. For this you need at last two IF noise sources, each feeding one of the channels (I and Q fed from the same source). Even better would be four separate IF noise sources.
Tuners can be used too, of course, but to be sure that their outputs are uncorrelated, tune each one to a different frequency. (Use the programs described below in the tuners section.)
Because this is noise statistics, the crosses will of course not sit still at zero correlation, but will jump around somewhat. The RMS amount of jumping will be approximately inversely proportional to the square root of the number of samples averaged.
Considering that we average 130K, 1.3M and 13M samples for the red, yellow and white crosses respectively, they should stay within circles of cca 0.003, 0.001 and 0.0003 radius, centered on the current value of correlation, 65% of the time.
With uncorrelated noise at the inputs, they should be distributed symmetrically around zero (display center), meaning zero average correlation. If they are shifted in any direction, there is some common signal intruding. Here we are much more sensitive than the FFT display above, because much more samples get averaged, compared to the 16K FFT size used in sidi1fft. So, even if there was nothing to be seen in the FFT display, there could still be some QRM coming in. Try some more of the QRM locating and removing procedures described above. Insufficient supply filtering can bring correlated signals into the two channels - try supplying the IF strips from a (small) 12V battery, maybe even two separate batteries.
Sometimes, it will be impossible to totally remove any residual correlation. If it is constant, and not too big, such a residual can be often tolerated, since it will only produce a DC pedestal on the otherwise AC fringes. Typically you will see something like the screenshot above, this amount of fixed correlation can be tolerated in most cases.
Next, check the "full correlation" point. Connect the same nosie source to all four inputs. The reading should jump close to 1. With a well matched set of 200kHz LP filters, it will be close to 0.99.
Because there is still some independent noise generated in the channels themselves, it is not possible to get a value of exactly one.
However, if you get less than 0.9, try to find out why. Check the time traces with "sidi1tdd", they should be almost identical. The most probable cuse of reduced correlation is bad filter matching, this can also be seen as unequal autocorrelation curves on the "sidi1tdd" display.
3.2 The discrete transistors based IF strip
Connect the IF strips to the PC (via either LPT or USB), leave the IF inputs unconnected (just leave the filter sockets empty) and connect the power supply.
Check the DC voltages according to the table below. Points marked with "*" can have a lot of AC, possibly fooling a digital multimeter.
The DC voltages should be:
Qx collector (10V regulator output)	10V +-0.2V
D1 cathode (limiter supply)		cca 9.3V
IC1 pin 3 (5V regulator output)		5V  +-0.1V
Q1..Q8 collector			cca 9.2V
Q1..Q8 emitor				cca 8.5V
Q9,Q10 emitor				cca 8.4V
Q11,Q12 emitor				cca 9V
Q11,Q12 collector			cca 2.1V  *
Q13,Q14 emitor (LED on)			cca 1.7V
4. The tuners
4.1 SL1935 based L-band tuners
This relates to the tuners from the "big tuner" version of the "SkyStar 2" cards.
Make sure that the required modifications have been made to the
tuners, see
Tuner harvesting and modification
for details.
First, we check the synthesizers. Connect the tuners to the I2C
interface (either LPT or UUUSB). Connect the power supplies,
the main 5v supply and the varicap supply. Connect a suitable
reference clock source to the tuners.
For the LPT version, use the
sl1935.c
program, and for the USB version the
xxxx.c
program (from a console / Xterm).
Edit the program source to enter the correct reference frequency.
(line ... in xxxx or line ... in yy).
Remember that there are two tuners (on the same I2C bus, but with different addresses), so you must do the checks for each one separately.
Run the program, and enter a frequency, for example
1000MHz.
If everything works OK, you should see
"PWR" should be "1" only the first time after power is applied to the
tuner, and "LOCK" should be "1", meaning that the synthesizer has locked.
Next, you can try a frequency outside the synth's range, for example
500MHz, and check that LOCK is zero.
With less than cca 16V on the varicap supply, there will be a "hole"
in the synthesizer coverage somewhere between cca 1200 and 1500MHz.
With a DC voltmeter or an oscilloscope, you can check the tuning voltage inside the tuner, and see how it changes when you program
different frequencies.
If you happen to have a spectrum analyzer covering the L band,
you can observe the LO. Just connect the SA to the tuner input and observe the leakage. (beware of DC! The center conductor DC can be switched off, see pin X of the tuners!)
If you get an "NO ACK" error, there is a problem with the I2C bus.
Possible problems are:
- Something not connected right
- Something not powered (I2C interface, tuner 5V)
- Wrong address of synthesizer chip (check tuner mod)
- No reference clock to the synthesizer
- Bad contact somewhere
- etc...
If you cannot get a lock (LOCK = 0) at any frequency,
the problems could be:
- frequency out of range
- bad varicap supply
- no reference clock to the synthesizer
- wrong reference frequency in software
- tuner hardware problem (maybe messed up during modification?)
- etc...
Once the synthesizers are running, it is time to check if you
can get some signal through the tuners.
At maximum gain, with no input, (inputs terminated) these tuners
produce cca 25mVpp of noise on the I and Q IF outputs.
Connect a noise source (an LNA) to the tuner inputs, and with an
oscilloscope observe the change in tuner output noise level, when
you power up the noise source (LNA).
If you have a signal generator (see
section 1.2
above), connect it to the tuner input and program the tuner's synthesizer to somewhere within a MHz or so of your source. Use an oscilloscope to observe the beat note at the IF outputs.
The beat note can be observed on the PC, without an oscilloscope, using either the time domain or spectrum analysis programs mentioned above, provided that the
beat frequency is low enough to pass the lowpass in the IF strip.
It should look similar to this:

If you can not tune your RF source, this can be a problem with the LPT
version, because the lowpasses are only 200kHz, and the tuner synth steps are usually a MHz or so.
NOTE: the tuner synth step can be reduced inside the software.
But a smaller step (lower reference) means more phase noise, that
is why the default step is large.
Another possibility, if the beat note is too high for the lowpass,
is to bypass the lowpass and observe the note aliased.
The LP filters are not extremely steep, so if the out of band signal is strong, you might still see some alias, even through the filter.
time domain check
quadrature err
4.1 SP5769 / SL1925 based L-band tuners
This relates to the tuners from the "small tuner" version of the "SkyStar 2" cards.
5. The whole SIDI
When all of the parts are working well, we can proceed to testing
the whole SIDI, and things will get a little more interesting.
We will check, if SIDI measures the correlation correctly.
For the LPT version, use the
xxxx.c
program, and for the USB version the
xxxx.c
program.
Connect loads to both tuner inputs.
(beware of DC! The center conductor DC can be switched off, see pin X of the tuners!)
Run the program, enter some frequency (say, 1000MHz) and check the correlation display. The measured correlation should be low (....)
statistika / stevilo vzorcev....
If the correlation is persistently higher than cca ...., you have some
signal leak. Check with frequency offset .... if the correlation
is still high, you have an IF leak. If it has fallen to expected level, the leak is on the RF side. It can be caused by LO leakage
of the tuners, that are not very well shielded.
Check the wiring, insert chokes into supply lines, increase the
distance between tuners, apply additional shielding....
Once you get the correlation down to the expected value,
re-check zero corr with LNAs (center pin supply...)
After the "zero correlation" point has been established,
it is time to apply a common signal to both inputs and see the
correlation.
For this, you need an L-band power divider, to connect the same
noise source (LNA....) to both inputs.
Even just connecting the power divider, there is usually some
increase in correlation - because the divider is not perfect,
the tuners will hear each others LO leakage!
Switch on the noise, and observe the increase in correlation.
Increasing the noise level (izracun!!!), you should be able to
get correlation readings close to 1. (NOTE: applying too much
noise can drive the tuners into saturation, so the correlation
reading might decrease again! (tuners are not good symmetric limiters))
if not, check corr on IF (en tuner izhod na vse vhode...)
6. Connecting the antennas
Well, if you successfully arrived up to this point, it means that
you have mastered the black art of analog RF :-)
But do not feel to victorious - the real monsters are still waiting!
6. Going for the real thing
Now at last it is time to show some real sky to this baby...
I strongly suggest you use the Sun for the first extraterrestrial target of your new SIDI, best on a sunny day - no problem for the radio waves to come through the clouds, but it is much easier to aim both antennas in the right direction, if you can see your target!
The antennas should best have between 10 an 15 dB of gain, this way the Sun will give you a good S/N, but the beams will still be broad enough for easy antenna pointing.
Put up the antennas, aim them approximately in the right direction, and set them for the same polarization. Then check for interference, as described above.
kagruncl
Up to main SIDI page
Copyright info